Polish vs Scandinavian Unemployment Among Women with Children Under 6 years
COMPARE
Polish
Scandinavian
Unemployment Among Women with Children Under 6 years
Unemployment Among Women with Children Under 6 years Comparison
Poles
Scandinavians
7.9%
UNEMPLOYMENT AMONG WOMEN WITH CHILDREN UNDER 6 YEARS
16.0/ 100
METRIC RATING
210th/ 347
METRIC RANK
7.4%
UNEMPLOYMENT AMONG WOMEN WITH CHILDREN UNDER 6 YEARS
83.0/ 100
METRIC RATING
140th/ 347
METRIC RANK
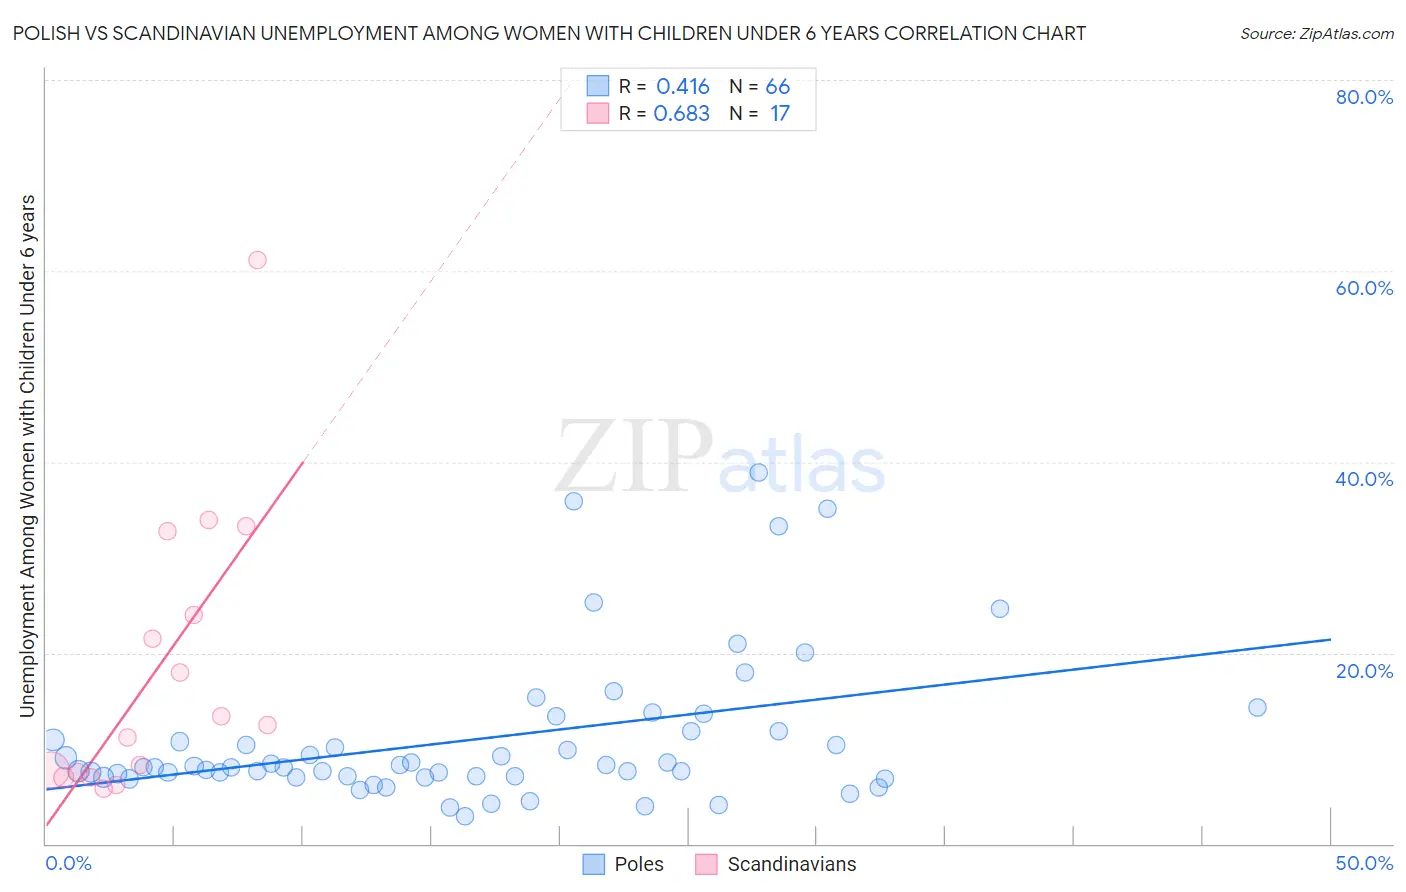
Polish vs Scandinavian Unemployment Among Women with Children Under 6 years Correlation Chart
The statistical analysis conducted on geographies consisting of 372,625,491 people shows a moderate positive correlation between the proportion of Poles and unemployment rate among women with children under the age of 6 in the United States with a correlation coefficient (R) of 0.416 and weighted average of 7.9%. Similarly, the statistical analysis conducted on geographies consisting of 330,455,497 people shows a significant positive correlation between the proportion of Scandinavians and unemployment rate among women with children under the age of 6 in the United States with a correlation coefficient (R) of 0.683 and weighted average of 7.4%, a difference of 5.5%.
Unemployment Among Women with Children Under 6 years Correlation Summary
| Measurement | Polish | Scandinavian |
| Minimum | 2.8% | 5.8% |
| Maximum | 38.9% | 61.1% |
| Range | 36.0% | 55.3% |
| Mean | 11.0% | 18.3% |
| Median | 8.0% | 12.5% |
| Interquartile 25% (IQ1) | 7.1% | 7.2% |
| Interquartile 75% (IQ3) | 11.8% | 28.4% |
| Interquartile Range (IQR) | 4.7% | 21.1% |
| Standard Deviation (Sample) | 7.8% | 14.9% |
| Standard Deviation (Population) | 7.7% | 14.5% |
Similar Demographics by Unemployment Among Women with Children Under 6 years
Demographics Similar to Poles by Unemployment Among Women with Children Under 6 years
In terms of unemployment among women with children under 6 years, the demographic groups most similar to Poles are Immigrants from Ecuador (7.9%, a difference of 0.13%), Costa Rican (7.8%, a difference of 0.18%), Immigrants from Syria (7.8%, a difference of 0.32%), Canadian (7.8%, a difference of 0.50%), and Swiss (7.9%, a difference of 0.50%).
| Demographics | Rating | Rank | Unemployment Among Women with Children Under 6 years |
| Spaniards | 23.3 /100 | #203 | Fair 7.8% |
| Lebanese | 22.2 /100 | #204 | Fair 7.8% |
| Immigrants | Immigrants | 21.4 /100 | #205 | Fair 7.8% |
| Hungarians | 21.2 /100 | #206 | Fair 7.8% |
| Canadians | 20.6 /100 | #207 | Fair 7.8% |
| Immigrants | Syria | 18.9 /100 | #208 | Poor 7.8% |
| Costa Ricans | 17.6 /100 | #209 | Poor 7.8% |
| Poles | 16.0 /100 | #210 | Poor 7.9% |
| Immigrants | Ecuador | 14.9 /100 | #211 | Poor 7.9% |
| Swiss | 12.3 /100 | #212 | Poor 7.9% |
| Scottish | 11.4 /100 | #213 | Poor 7.9% |
| Spanish | 11.3 /100 | #214 | Poor 7.9% |
| Ecuadorians | 11.2 /100 | #215 | Poor 7.9% |
| Immigrants | Lebanon | 11.1 /100 | #216 | Poor 7.9% |
| Immigrants | Nigeria | 10.3 /100 | #217 | Poor 7.9% |
Demographics Similar to Scandinavians by Unemployment Among Women with Children Under 6 years
In terms of unemployment among women with children under 6 years, the demographic groups most similar to Scandinavians are Greek (7.4%, a difference of 0.060%), Immigrants from Colombia (7.4%, a difference of 0.11%), Immigrants from Norway (7.4%, a difference of 0.13%), Immigrants from Argentina (7.5%, a difference of 0.18%), and Immigrants from Cambodia (7.4%, a difference of 0.20%).
| Demographics | Rating | Rank | Unemployment Among Women with Children Under 6 years |
| Immigrants | Uganda | 86.5 /100 | #133 | Excellent 7.4% |
| Immigrants | Bolivia | 85.7 /100 | #134 | Excellent 7.4% |
| Immigrants | Northern Africa | 85.3 /100 | #135 | Excellent 7.4% |
| Immigrants | Morocco | 84.9 /100 | #136 | Excellent 7.4% |
| Immigrants | Cambodia | 84.6 /100 | #137 | Excellent 7.4% |
| Immigrants | Norway | 84.1 /100 | #138 | Excellent 7.4% |
| Immigrants | Colombia | 83.9 /100 | #139 | Excellent 7.4% |
| Scandinavians | 83.0 /100 | #140 | Excellent 7.4% |
| Greeks | 82.6 /100 | #141 | Excellent 7.4% |
| Immigrants | Argentina | 81.5 /100 | #142 | Excellent 7.5% |
| Koreans | 81.3 /100 | #143 | Excellent 7.5% |
| Europeans | 79.1 /100 | #144 | Good 7.5% |
| Immigrants | Jordan | 78.9 /100 | #145 | Good 7.5% |
| Japanese | 78.9 /100 | #146 | Good 7.5% |
| Immigrants | Oceania | 78.4 /100 | #147 | Good 7.5% |