Polish vs Immigrants from Singapore Associate's Degree
COMPARE
Polish
Immigrants from Singapore
Associate's Degree
Associate's Degree Comparison
Poles
Immigrants from Singapore
48.0%
ASSOCIATE'S DEGREE
87.3/ 100
METRIC RATING
138th/ 347
METRIC RANK
58.9%
ASSOCIATE'S DEGREE
100.0/ 100
METRIC RATING
2nd/ 347
METRIC RANK
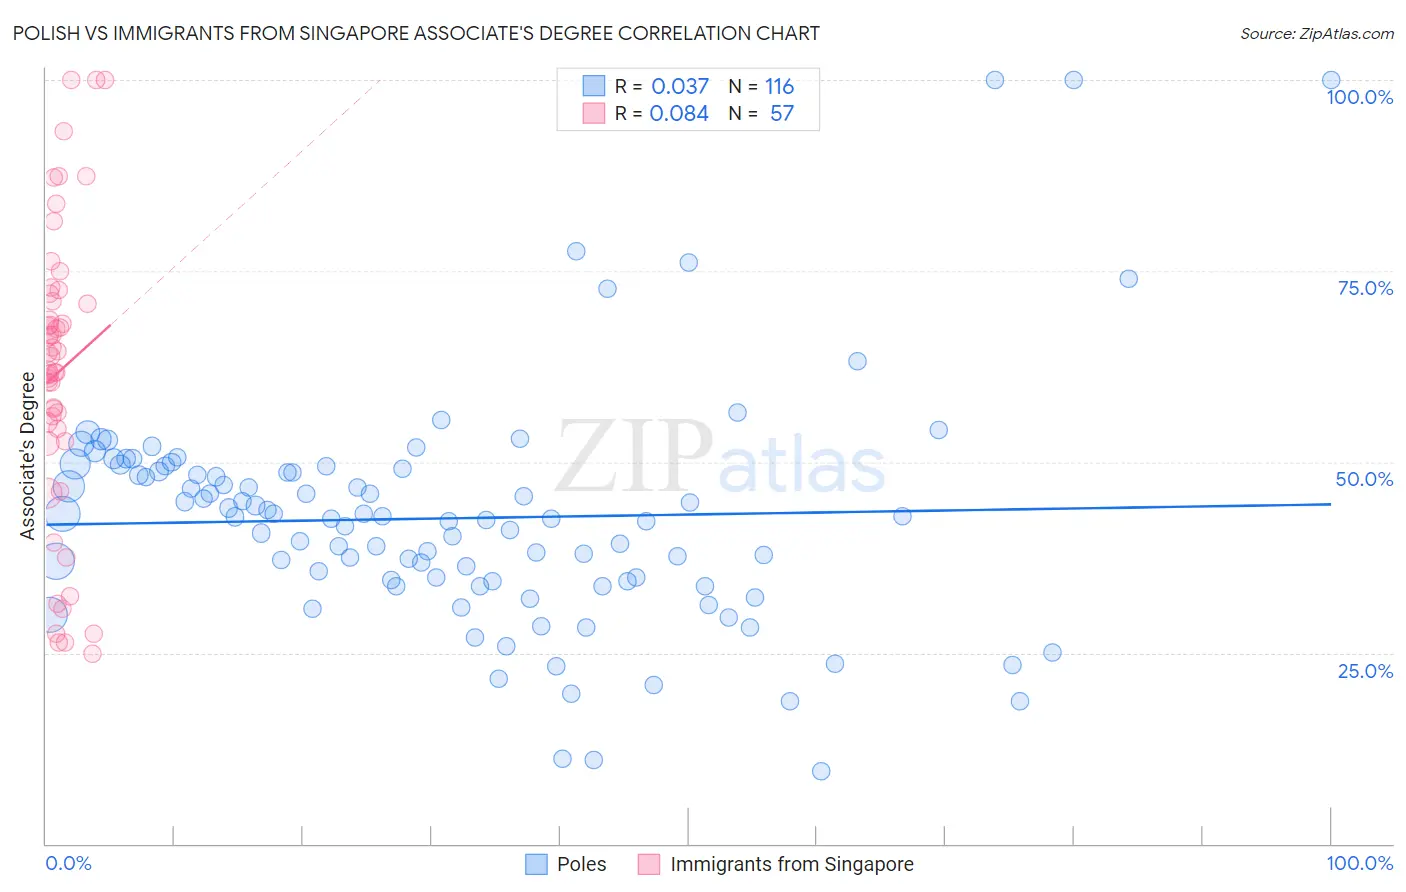
Polish vs Immigrants from Singapore Associate's Degree Correlation Chart
The statistical analysis conducted on geographies consisting of 560,512,147 people shows no correlation between the proportion of Poles and percentage of population with at least associate's degree education in the United States with a correlation coefficient (R) of 0.037 and weighted average of 48.0%. Similarly, the statistical analysis conducted on geographies consisting of 137,518,167 people shows a slight positive correlation between the proportion of Immigrants from Singapore and percentage of population with at least associate's degree education in the United States with a correlation coefficient (R) of 0.084 and weighted average of 58.9%, a difference of 22.7%.
Associate's Degree Correlation Summary
| Measurement | Polish | Immigrants from Singapore |
| Minimum | 9.5% | 24.9% |
| Maximum | 100.0% | 100.0% |
| Range | 90.5% | 75.1% |
| Mean | 42.6% | 61.8% |
| Median | 42.7% | 63.8% |
| Interquartile 25% (IQ1) | 34.4% | 53.5% |
| Interquartile 75% (IQ3) | 48.9% | 71.5% |
| Interquartile Range (IQR) | 14.5% | 18.1% |
| Standard Deviation (Sample) | 15.3% | 19.1% |
| Standard Deviation (Population) | 15.2% | 18.9% |
Similar Demographics by Associate's Degree
Demographics Similar to Poles by Associate's Degree
In terms of associate's degree, the demographic groups most similar to Poles are Immigrants from Eritrea (48.1%, a difference of 0.070%), Pakistani (48.1%, a difference of 0.11%), European (48.2%, a difference of 0.29%), Moroccan (48.2%, a difference of 0.35%), and Slovene (47.9%, a difference of 0.35%).
| Demographics | Rating | Rank | Associate's Degree |
| Icelanders | 90.8 /100 | #131 | Exceptional 48.3% |
| Immigrants | Albania | 89.9 /100 | #132 | Excellent 48.2% |
| Assyrians/Chaldeans/Syriacs | 89.4 /100 | #133 | Excellent 48.2% |
| Moroccans | 89.3 /100 | #134 | Excellent 48.2% |
| Europeans | 89.0 /100 | #135 | Excellent 48.2% |
| Pakistanis | 88.0 /100 | #136 | Excellent 48.1% |
| Immigrants | Eritrea | 87.8 /100 | #137 | Excellent 48.1% |
| Poles | 87.3 /100 | #138 | Excellent 48.0% |
| Slovenes | 85.1 /100 | #139 | Excellent 47.9% |
| Immigrants | Southern Europe | 84.4 /100 | #140 | Excellent 47.8% |
| Taiwanese | 83.3 /100 | #141 | Excellent 47.7% |
| Sierra Leoneans | 82.9 /100 | #142 | Excellent 47.7% |
| Norwegians | 81.0 /100 | #143 | Excellent 47.6% |
| Slavs | 80.5 /100 | #144 | Excellent 47.6% |
| Canadians | 79.0 /100 | #145 | Good 47.5% |
Demographics Similar to Immigrants from Singapore by Associate's Degree
In terms of associate's degree, the demographic groups most similar to Immigrants from Singapore are Immigrants from India (58.5%, a difference of 0.66%), Immigrants from Taiwan (58.4%, a difference of 0.91%), Iranian (58.2%, a difference of 1.3%), Filipino (59.8%, a difference of 1.5%), and Okinawan (57.7%, a difference of 2.2%).
| Demographics | Rating | Rank | Associate's Degree |
| Filipinos | 100.0 /100 | #1 | Exceptional 59.8% |
| Immigrants | Singapore | 100.0 /100 | #2 | Exceptional 58.9% |
| Immigrants | India | 100.0 /100 | #3 | Exceptional 58.5% |
| Immigrants | Taiwan | 100.0 /100 | #4 | Exceptional 58.4% |
| Iranians | 100.0 /100 | #5 | Exceptional 58.2% |
| Okinawans | 100.0 /100 | #6 | Exceptional 57.7% |
| Immigrants | Iran | 100.0 /100 | #7 | Exceptional 57.7% |
| Thais | 100.0 /100 | #8 | Exceptional 57.4% |
| Immigrants | Israel | 100.0 /100 | #9 | Exceptional 56.8% |
| Cypriots | 100.0 /100 | #10 | Exceptional 56.4% |
| Immigrants | Australia | 100.0 /100 | #11 | Exceptional 55.8% |
| Immigrants | South Central Asia | 100.0 /100 | #12 | Exceptional 55.7% |
| Immigrants | China | 100.0 /100 | #13 | Exceptional 55.5% |
| Immigrants | Hong Kong | 100.0 /100 | #14 | Exceptional 55.4% |
| Immigrants | Eastern Asia | 100.0 /100 | #15 | Exceptional 55.4% |