Immigrants from Barbados vs Scandinavian Associate's Degree
COMPARE
Immigrants from Barbados
Scandinavian
Associate's Degree
Associate's Degree Comparison
Immigrants from Barbados
Scandinavians
43.3%
ASSOCIATE'S DEGREE
2.9/ 100
METRIC RATING
230th/ 347
METRIC RANK
46.9%
ASSOCIATE'S DEGREE
65.2/ 100
METRIC RATING
161st/ 347
METRIC RANK
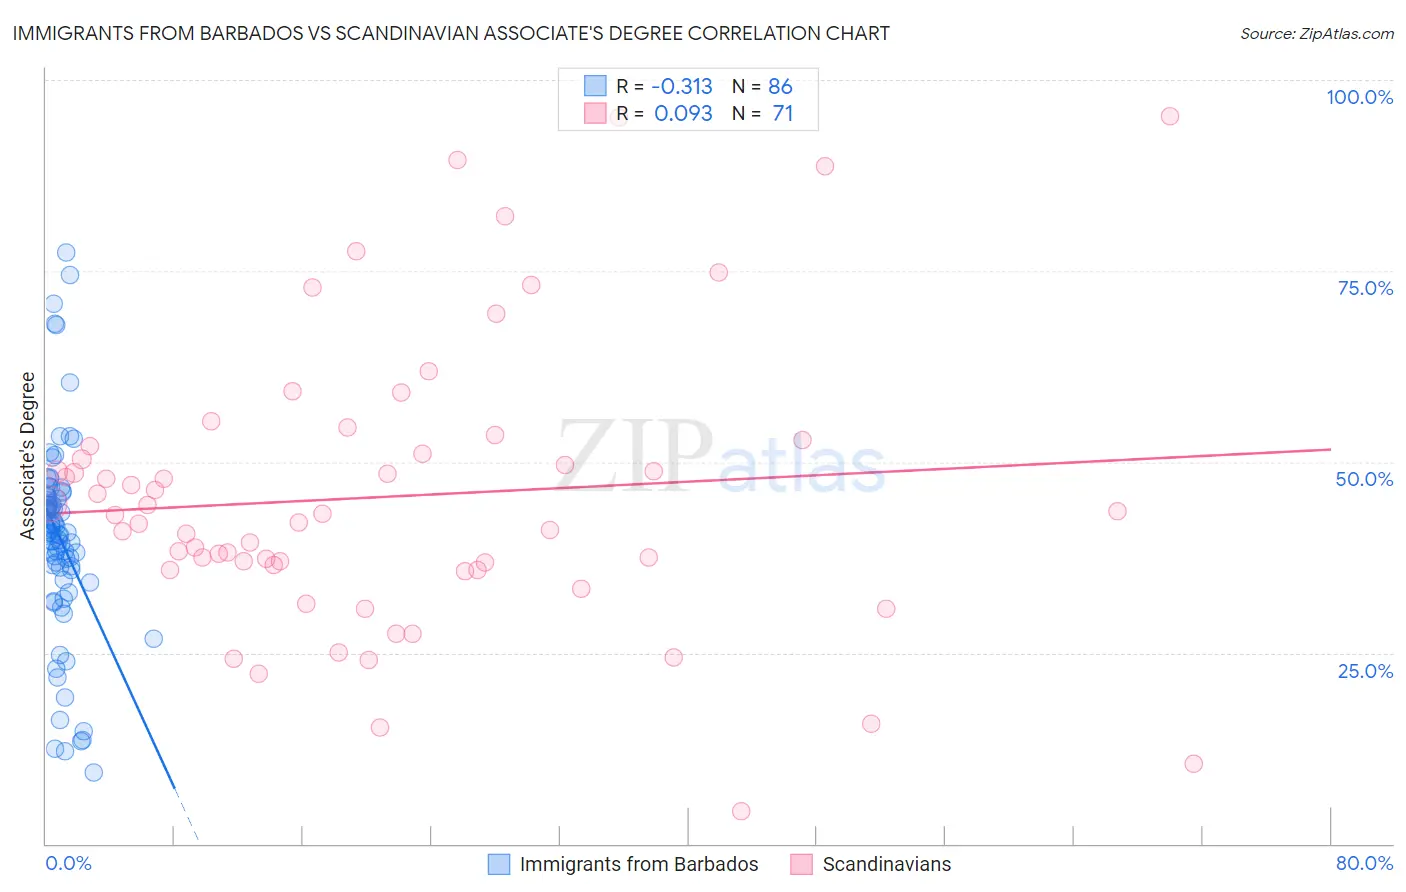
Immigrants from Barbados vs Scandinavian Associate's Degree Correlation Chart
The statistical analysis conducted on geographies consisting of 112,783,541 people shows a mild negative correlation between the proportion of Immigrants from Barbados and percentage of population with at least associate's degree education in the United States with a correlation coefficient (R) of -0.313 and weighted average of 43.3%. Similarly, the statistical analysis conducted on geographies consisting of 472,632,829 people shows a slight positive correlation between the proportion of Scandinavians and percentage of population with at least associate's degree education in the United States with a correlation coefficient (R) of 0.093 and weighted average of 46.9%, a difference of 8.3%.
Associate's Degree Correlation Summary
| Measurement | Immigrants from Barbados | Scandinavian |
| Minimum | 9.3% | 4.2% |
| Maximum | 77.4% | 95.2% |
| Range | 68.2% | 91.0% |
| Mean | 40.0% | 45.5% |
| Median | 40.7% | 43.1% |
| Interquartile 25% (IQ1) | 35.9% | 35.9% |
| Interquartile 75% (IQ3) | 45.3% | 52.1% |
| Interquartile Range (IQR) | 9.5% | 16.2% |
| Standard Deviation (Sample) | 13.1% | 18.8% |
| Standard Deviation (Population) | 13.0% | 18.7% |
Similar Demographics by Associate's Degree
Demographics Similar to Immigrants from Barbados by Associate's Degree
In terms of associate's degree, the demographic groups most similar to Immigrants from Barbados are Liberian (43.3%, a difference of 0.010%), Immigrants from Trinidad and Tobago (43.3%, a difference of 0.070%), Hmong (43.4%, a difference of 0.23%), Native Hawaiian (43.1%, a difference of 0.43%), and Tongan (43.0%, a difference of 0.60%).
| Demographics | Rating | Rank | Associate's Degree |
| Sub-Saharan Africans | 5.5 /100 | #223 | Tragic 43.9% |
| West Indians | 5.2 /100 | #224 | Tragic 43.8% |
| Guamanians/Chamorros | 4.8 /100 | #225 | Tragic 43.8% |
| Immigrants | Burma/Myanmar | 4.3 /100 | #226 | Tragic 43.7% |
| Trinidadians and Tobagonians | 4.0 /100 | #227 | Tragic 43.6% |
| Hmong | 3.2 /100 | #228 | Tragic 43.4% |
| Immigrants | Trinidad and Tobago | 3.0 /100 | #229 | Tragic 43.3% |
| Immigrants | Barbados | 2.9 /100 | #230 | Tragic 43.3% |
| Liberians | 2.9 /100 | #231 | Tragic 43.3% |
| Native Hawaiians | 2.3 /100 | #232 | Tragic 43.1% |
| Tongans | 2.2 /100 | #233 | Tragic 43.0% |
| Tlingit-Haida | 2.1 /100 | #234 | Tragic 43.0% |
| Ecuadorians | 2.0 /100 | #235 | Tragic 43.0% |
| Immigrants | St. Vincent and the Grenadines | 1.9 /100 | #236 | Tragic 42.9% |
| Immigrants | Nonimmigrants | 1.9 /100 | #237 | Tragic 42.9% |
Demographics Similar to Scandinavians by Associate's Degree
In terms of associate's degree, the demographic groups most similar to Scandinavians are Scottish (46.9%, a difference of 0.020%), Immigrants from Africa (46.8%, a difference of 0.16%), Somali (46.8%, a difference of 0.22%), Colombian (46.8%, a difference of 0.23%), and Immigrants from Poland (47.1%, a difference of 0.33%).
| Demographics | Rating | Rank | Associate's Degree |
| Immigrants | Kenya | 72.1 /100 | #154 | Good 47.2% |
| Kenyans | 70.6 /100 | #155 | Good 47.1% |
| South Americans | 70.5 /100 | #156 | Good 47.1% |
| Sudanese | 70.3 /100 | #157 | Good 47.1% |
| Immigrants | Germany | 69.7 /100 | #158 | Good 47.1% |
| Immigrants | Poland | 69.2 /100 | #159 | Good 47.1% |
| Scottish | 65.4 /100 | #160 | Good 46.9% |
| Scandinavians | 65.2 /100 | #161 | Good 46.9% |
| Immigrants | Africa | 63.2 /100 | #162 | Good 46.8% |
| Somalis | 62.5 /100 | #163 | Good 46.8% |
| Colombians | 62.4 /100 | #164 | Good 46.8% |
| Immigrants | South America | 59.9 /100 | #165 | Average 46.7% |
| Hungarians | 59.3 /100 | #166 | Average 46.7% |
| Immigrants | Sierra Leone | 59.2 /100 | #167 | Average 46.7% |
| Immigrants | Somalia | 55.5 /100 | #168 | Average 46.5% |