Polish vs Blackfeet Associate's Degree
COMPARE
Polish
Blackfeet
Associate's Degree
Associate's Degree Comparison
Poles
Blackfeet
48.0%
ASSOCIATE'S DEGREE
87.3/ 100
METRIC RATING
138th/ 347
METRIC RANK
40.3%
ASSOCIATE'S DEGREE
0.1/ 100
METRIC RATING
277th/ 347
METRIC RANK
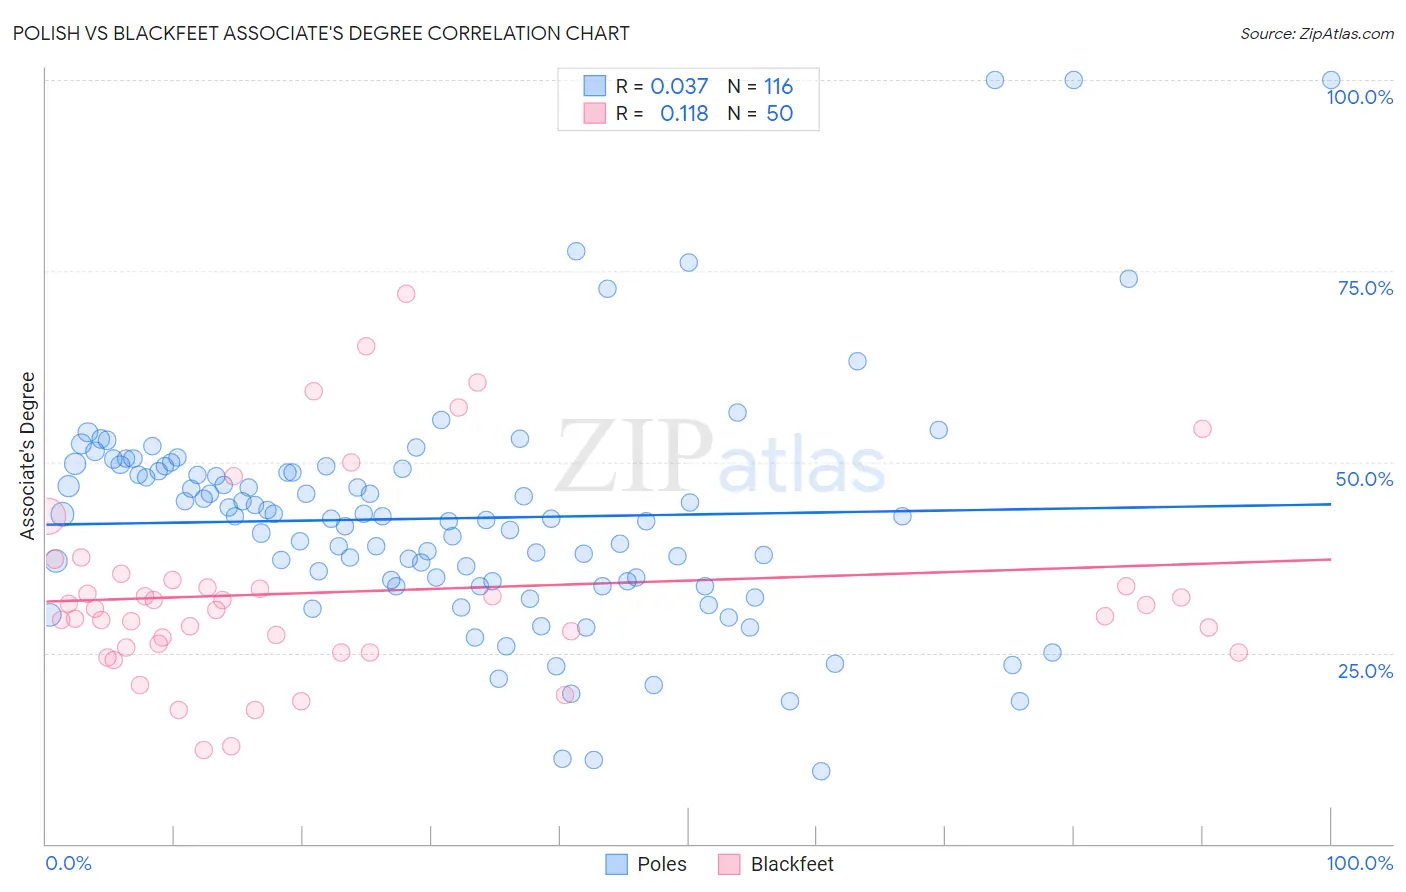
Polish vs Blackfeet Associate's Degree Correlation Chart
The statistical analysis conducted on geographies consisting of 560,512,147 people shows no correlation between the proportion of Poles and percentage of population with at least associate's degree education in the United States with a correlation coefficient (R) of 0.037 and weighted average of 48.0%. Similarly, the statistical analysis conducted on geographies consisting of 309,580,719 people shows a poor positive correlation between the proportion of Blackfeet and percentage of population with at least associate's degree education in the United States with a correlation coefficient (R) of 0.118 and weighted average of 40.3%, a difference of 19.1%.
Associate's Degree Correlation Summary
| Measurement | Polish | Blackfeet |
| Minimum | 9.5% | 12.2% |
| Maximum | 100.0% | 72.0% |
| Range | 90.5% | 59.8% |
| Mean | 42.6% | 33.0% |
| Median | 42.7% | 30.7% |
| Interquartile 25% (IQ1) | 34.4% | 25.7% |
| Interquartile 75% (IQ3) | 48.9% | 34.5% |
| Interquartile Range (IQR) | 14.5% | 8.8% |
| Standard Deviation (Sample) | 15.3% | 13.0% |
| Standard Deviation (Population) | 15.2% | 12.8% |
Similar Demographics by Associate's Degree
Demographics Similar to Poles by Associate's Degree
In terms of associate's degree, the demographic groups most similar to Poles are Immigrants from Eritrea (48.1%, a difference of 0.070%), Pakistani (48.1%, a difference of 0.11%), European (48.2%, a difference of 0.29%), Moroccan (48.2%, a difference of 0.35%), and Slovene (47.9%, a difference of 0.35%).
| Demographics | Rating | Rank | Associate's Degree |
| Icelanders | 90.8 /100 | #131 | Exceptional 48.3% |
| Immigrants | Albania | 89.9 /100 | #132 | Excellent 48.2% |
| Assyrians/Chaldeans/Syriacs | 89.4 /100 | #133 | Excellent 48.2% |
| Moroccans | 89.3 /100 | #134 | Excellent 48.2% |
| Europeans | 89.0 /100 | #135 | Excellent 48.2% |
| Pakistanis | 88.0 /100 | #136 | Excellent 48.1% |
| Immigrants | Eritrea | 87.8 /100 | #137 | Excellent 48.1% |
| Poles | 87.3 /100 | #138 | Excellent 48.0% |
| Slovenes | 85.1 /100 | #139 | Excellent 47.9% |
| Immigrants | Southern Europe | 84.4 /100 | #140 | Excellent 47.8% |
| Taiwanese | 83.3 /100 | #141 | Excellent 47.7% |
| Sierra Leoneans | 82.9 /100 | #142 | Excellent 47.7% |
| Norwegians | 81.0 /100 | #143 | Excellent 47.6% |
| Slavs | 80.5 /100 | #144 | Excellent 47.6% |
| Canadians | 79.0 /100 | #145 | Good 47.5% |
Demographics Similar to Blackfeet by Associate's Degree
In terms of associate's degree, the demographic groups most similar to Blackfeet are Puerto Rican (40.4%, a difference of 0.050%), Ottawa (40.3%, a difference of 0.15%), Potawatomi (40.4%, a difference of 0.16%), Immigrants from Nicaragua (40.3%, a difference of 0.19%), and Immigrants from Dominica (40.5%, a difference of 0.30%).
| Demographics | Rating | Rank | Associate's Degree |
| Chippewa | 0.2 /100 | #270 | Tragic 40.7% |
| Immigrants | Laos | 0.1 /100 | #271 | Tragic 40.7% |
| Belizeans | 0.1 /100 | #272 | Tragic 40.6% |
| Puget Sound Salish | 0.1 /100 | #273 | Tragic 40.5% |
| Immigrants | Dominica | 0.1 /100 | #274 | Tragic 40.5% |
| Potawatomi | 0.1 /100 | #275 | Tragic 40.4% |
| Puerto Ricans | 0.1 /100 | #276 | Tragic 40.4% |
| Blackfeet | 0.1 /100 | #277 | Tragic 40.3% |
| Ottawa | 0.1 /100 | #278 | Tragic 40.3% |
| Immigrants | Nicaragua | 0.1 /100 | #279 | Tragic 40.3% |
| Immigrants | Micronesia | 0.1 /100 | #280 | Tragic 40.2% |
| Immigrants | Portugal | 0.1 /100 | #281 | Tragic 40.1% |
| Bangladeshis | 0.1 /100 | #282 | Tragic 40.0% |
| Haitians | 0.1 /100 | #283 | Tragic 40.0% |
| Comanche | 0.1 /100 | #284 | Tragic 39.9% |