Immigrants from Jamaica vs Scandinavian Associate's Degree
COMPARE
Immigrants from Jamaica
Scandinavian
Associate's Degree
Associate's Degree Comparison
Immigrants from Jamaica
Scandinavians
41.5%
ASSOCIATE'S DEGREE
0.3/ 100
METRIC RATING
263rd/ 347
METRIC RANK
46.9%
ASSOCIATE'S DEGREE
65.2/ 100
METRIC RATING
161st/ 347
METRIC RANK
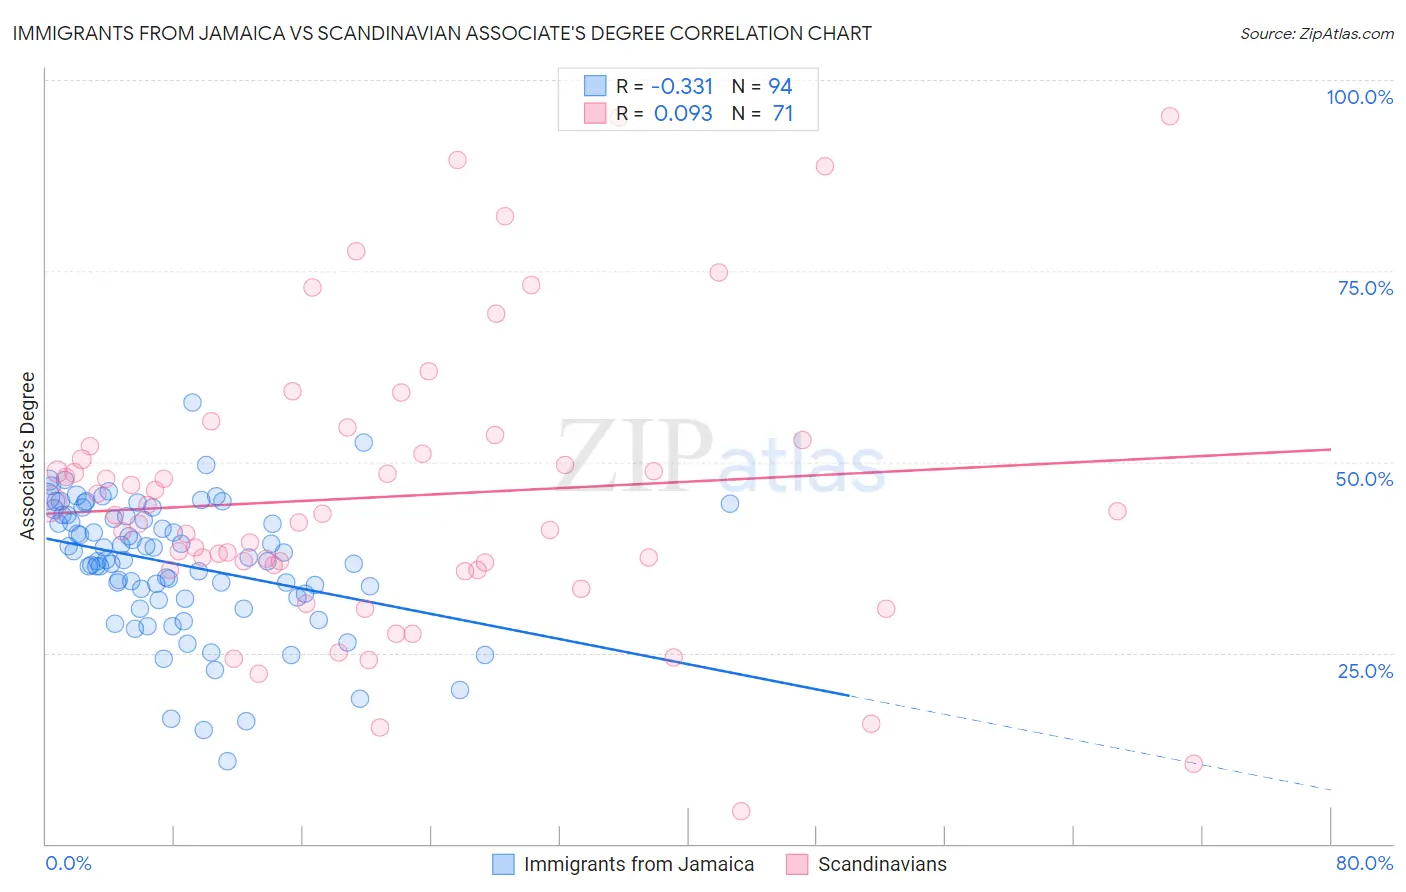
Immigrants from Jamaica vs Scandinavian Associate's Degree Correlation Chart
The statistical analysis conducted on geographies consisting of 301,813,943 people shows a mild negative correlation between the proportion of Immigrants from Jamaica and percentage of population with at least associate's degree education in the United States with a correlation coefficient (R) of -0.331 and weighted average of 41.5%. Similarly, the statistical analysis conducted on geographies consisting of 472,632,829 people shows a slight positive correlation between the proportion of Scandinavians and percentage of population with at least associate's degree education in the United States with a correlation coefficient (R) of 0.093 and weighted average of 46.9%, a difference of 13.1%.
Associate's Degree Correlation Summary
| Measurement | Immigrants from Jamaica | Scandinavian |
| Minimum | 10.8% | 4.2% |
| Maximum | 57.7% | 95.2% |
| Range | 46.9% | 91.0% |
| Mean | 36.6% | 45.5% |
| Median | 37.3% | 43.1% |
| Interquartile 25% (IQ1) | 32.3% | 35.9% |
| Interquartile 75% (IQ3) | 43.1% | 52.1% |
| Interquartile Range (IQR) | 10.8% | 16.2% |
| Standard Deviation (Sample) | 8.6% | 18.8% |
| Standard Deviation (Population) | 8.6% | 18.7% |
Similar Demographics by Associate's Degree
Demographics Similar to Immigrants from Jamaica by Associate's Degree
In terms of associate's degree, the demographic groups most similar to Immigrants from Jamaica are Osage (41.5%, a difference of 0.010%), Bahamian (41.5%, a difference of 0.020%), Nicaraguan (41.5%, a difference of 0.11%), Marshallese (41.6%, a difference of 0.24%), and Malaysian (41.6%, a difference of 0.43%).
| Demographics | Rating | Rank | Associate's Degree |
| Immigrants | Congo | 0.5 /100 | #256 | Tragic 41.8% |
| Spanish Americans | 0.5 /100 | #257 | Tragic 41.8% |
| Japanese | 0.5 /100 | #258 | Tragic 41.7% |
| Malaysians | 0.4 /100 | #259 | Tragic 41.6% |
| Marshallese | 0.4 /100 | #260 | Tragic 41.6% |
| Nicaraguans | 0.4 /100 | #261 | Tragic 41.5% |
| Bahamians | 0.4 /100 | #262 | Tragic 41.5% |
| Immigrants | Jamaica | 0.3 /100 | #263 | Tragic 41.5% |
| Osage | 0.3 /100 | #264 | Tragic 41.5% |
| Africans | 0.2 /100 | #265 | Tragic 41.1% |
| Samoans | 0.2 /100 | #266 | Tragic 41.1% |
| Hawaiians | 0.2 /100 | #267 | Tragic 40.9% |
| Central American Indians | 0.2 /100 | #268 | Tragic 40.8% |
| Americans | 0.2 /100 | #269 | Tragic 40.8% |
| Chippewa | 0.2 /100 | #270 | Tragic 40.7% |
Demographics Similar to Scandinavians by Associate's Degree
In terms of associate's degree, the demographic groups most similar to Scandinavians are Scottish (46.9%, a difference of 0.020%), Immigrants from Africa (46.8%, a difference of 0.16%), Somali (46.8%, a difference of 0.22%), Colombian (46.8%, a difference of 0.23%), and Immigrants from Poland (47.1%, a difference of 0.33%).
| Demographics | Rating | Rank | Associate's Degree |
| Immigrants | Kenya | 72.1 /100 | #154 | Good 47.2% |
| Kenyans | 70.6 /100 | #155 | Good 47.1% |
| South Americans | 70.5 /100 | #156 | Good 47.1% |
| Sudanese | 70.3 /100 | #157 | Good 47.1% |
| Immigrants | Germany | 69.7 /100 | #158 | Good 47.1% |
| Immigrants | Poland | 69.2 /100 | #159 | Good 47.1% |
| Scottish | 65.4 /100 | #160 | Good 46.9% |
| Scandinavians | 65.2 /100 | #161 | Good 46.9% |
| Immigrants | Africa | 63.2 /100 | #162 | Good 46.8% |
| Somalis | 62.5 /100 | #163 | Good 46.8% |
| Colombians | 62.4 /100 | #164 | Good 46.8% |
| Immigrants | South America | 59.9 /100 | #165 | Average 46.7% |
| Hungarians | 59.3 /100 | #166 | Average 46.7% |
| Immigrants | Sierra Leone | 59.2 /100 | #167 | Average 46.7% |
| Immigrants | Somalia | 55.5 /100 | #168 | Average 46.5% |