Pima vs Honduran 9th Grade
COMPARE
Pima
Honduran
9th Grade
9th Grade Comparison
Pima
Hondurans
93.9%
9TH GRADE
0.4/ 100
METRIC RATING
260th/ 347
METRIC RANK
91.0%
9TH GRADE
0.0/ 100
METRIC RATING
329th/ 347
METRIC RANK
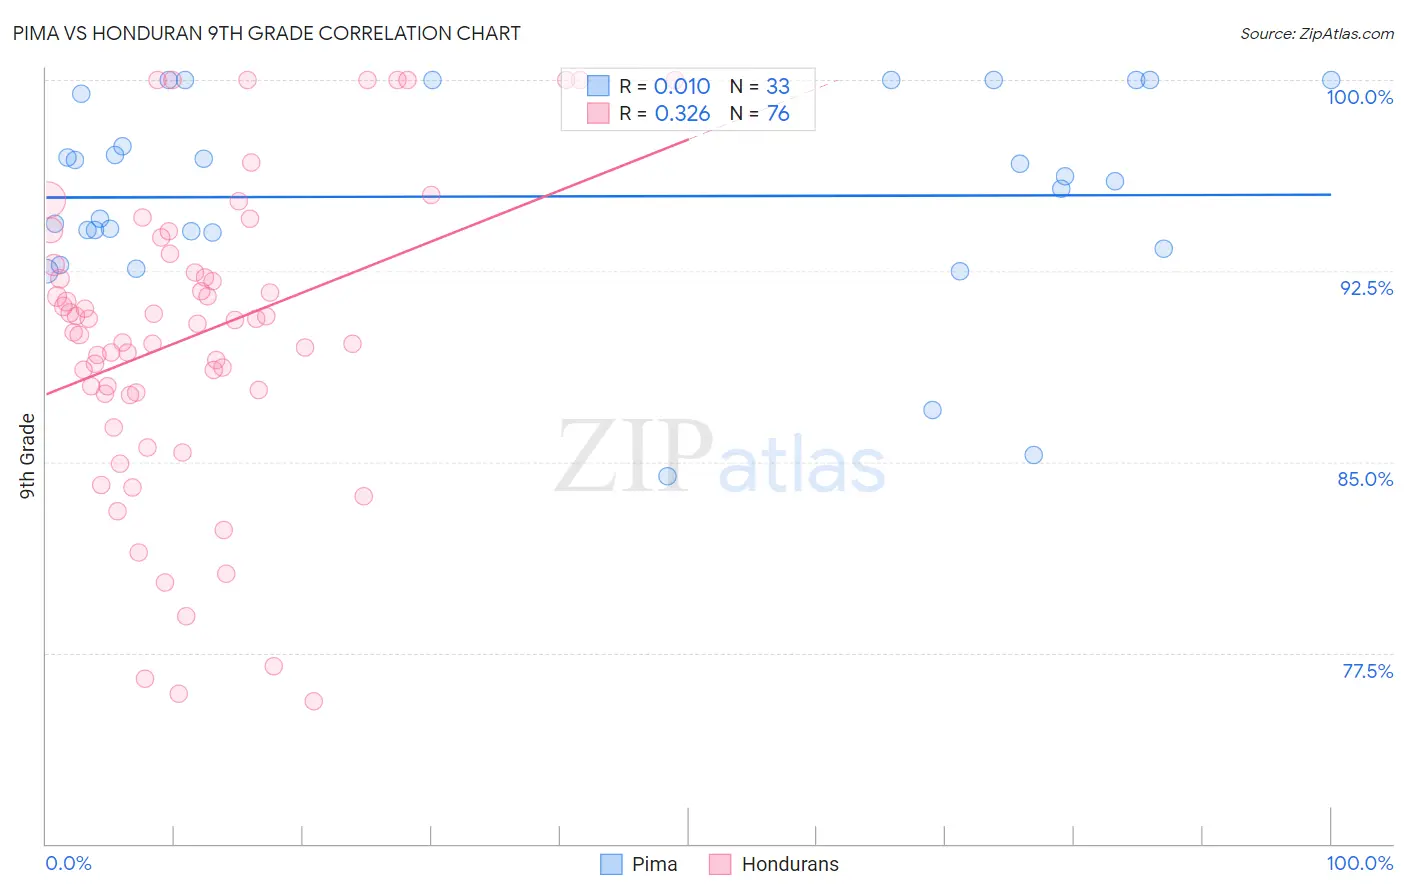
Pima vs Honduran 9th Grade Correlation Chart
The statistical analysis conducted on geographies consisting of 61,552,136 people shows no correlation between the proportion of Pima and percentage of population with at least 9th grade education in the United States with a correlation coefficient (R) of 0.010 and weighted average of 93.9%. Similarly, the statistical analysis conducted on geographies consisting of 357,784,803 people shows a mild positive correlation between the proportion of Hondurans and percentage of population with at least 9th grade education in the United States with a correlation coefficient (R) of 0.326 and weighted average of 91.0%, a difference of 3.2%.
9th Grade Correlation Summary
| Measurement | Pima | Honduran |
| Minimum | 84.5% | 75.6% |
| Maximum | 100.0% | 100.0% |
| Range | 15.5% | 24.4% |
| Mean | 95.4% | 90.0% |
| Median | 96.0% | 90.5% |
| Interquartile 25% (IQ1) | 93.7% | 87.7% |
| Interquartile 75% (IQ3) | 99.7% | 92.9% |
| Interquartile Range (IQR) | 6.0% | 5.2% |
| Standard Deviation (Sample) | 4.1% | 5.9% |
| Standard Deviation (Population) | 4.0% | 5.9% |
Similar Demographics by 9th Grade
Demographics Similar to Pima by 9th Grade
In terms of 9th grade, the demographic groups most similar to Pima are Immigrants from Thailand (93.9%, a difference of 0.010%), Ghanaian (93.9%, a difference of 0.010%), South American (93.9%, a difference of 0.010%), Immigrants from Costa Rica (94.0%, a difference of 0.020%), and Immigrants from Jamaica (93.9%, a difference of 0.020%).
| Demographics | Rating | Rank | 9th Grade |
| Colombians | 0.8 /100 | #253 | Tragic 94.0% |
| U.S. Virgin Islanders | 0.7 /100 | #254 | Tragic 94.0% |
| Immigrants | Nigeria | 0.6 /100 | #255 | Tragic 94.0% |
| Immigrants | Afghanistan | 0.5 /100 | #256 | Tragic 94.0% |
| Immigrants | Costa Rica | 0.5 /100 | #257 | Tragic 94.0% |
| Immigrants | Thailand | 0.5 /100 | #258 | Tragic 93.9% |
| Ghanaians | 0.5 /100 | #259 | Tragic 93.9% |
| Pima | 0.4 /100 | #260 | Tragic 93.9% |
| South Americans | 0.4 /100 | #261 | Tragic 93.9% |
| Immigrants | Jamaica | 0.4 /100 | #262 | Tragic 93.9% |
| Immigrants | Uzbekistan | 0.4 /100 | #263 | Tragic 93.9% |
| Immigrants | Congo | 0.4 /100 | #264 | Tragic 93.9% |
| Natives/Alaskans | 0.4 /100 | #265 | Tragic 93.9% |
| Navajo | 0.3 /100 | #266 | Tragic 93.9% |
| Armenians | 0.3 /100 | #267 | Tragic 93.9% |
Demographics Similar to Hondurans by 9th Grade
In terms of 9th grade, the demographic groups most similar to Hondurans are Dominican (91.1%, a difference of 0.030%), Immigrants from Cabo Verde (90.9%, a difference of 0.12%), Mexican American Indian (90.9%, a difference of 0.15%), Hispanic or Latino (90.9%, a difference of 0.17%), and Immigrants from Yemen (90.8%, a difference of 0.26%).
| Demographics | Rating | Rank | 9th Grade |
| Belizeans | 0.0 /100 | #322 | Tragic 91.8% |
| Puerto Ricans | 0.0 /100 | #323 | Tragic 91.8% |
| Immigrants | Belize | 0.0 /100 | #324 | Tragic 91.8% |
| Central American Indians | 0.0 /100 | #325 | Tragic 91.5% |
| Immigrants | Armenia | 0.0 /100 | #326 | Tragic 91.4% |
| Immigrants | Nicaragua | 0.0 /100 | #327 | Tragic 91.3% |
| Dominicans | 0.0 /100 | #328 | Tragic 91.1% |
| Hondurans | 0.0 /100 | #329 | Tragic 91.0% |
| Immigrants | Cabo Verde | 0.0 /100 | #330 | Tragic 90.9% |
| Mexican American Indians | 0.0 /100 | #331 | Tragic 90.9% |
| Hispanics or Latinos | 0.0 /100 | #332 | Tragic 90.9% |
| Immigrants | Yemen | 0.0 /100 | #333 | Tragic 90.8% |
| Immigrants | Azores | 0.0 /100 | #334 | Tragic 90.8% |
| Immigrants | Honduras | 0.0 /100 | #335 | Tragic 90.6% |
| Immigrants | Dominican Republic | 0.0 /100 | #336 | Tragic 90.5% |