Pima vs Croatian 10th Grade
COMPARE
Pima
Croatian
10th Grade
10th Grade Comparison
Pima
Croatians
91.2%
10TH GRADE
0.0/ 100
METRIC RATING
304th/ 347
METRIC RANK
95.7%
10TH GRADE
100.0/ 100
METRIC RATING
10th/ 347
METRIC RANK
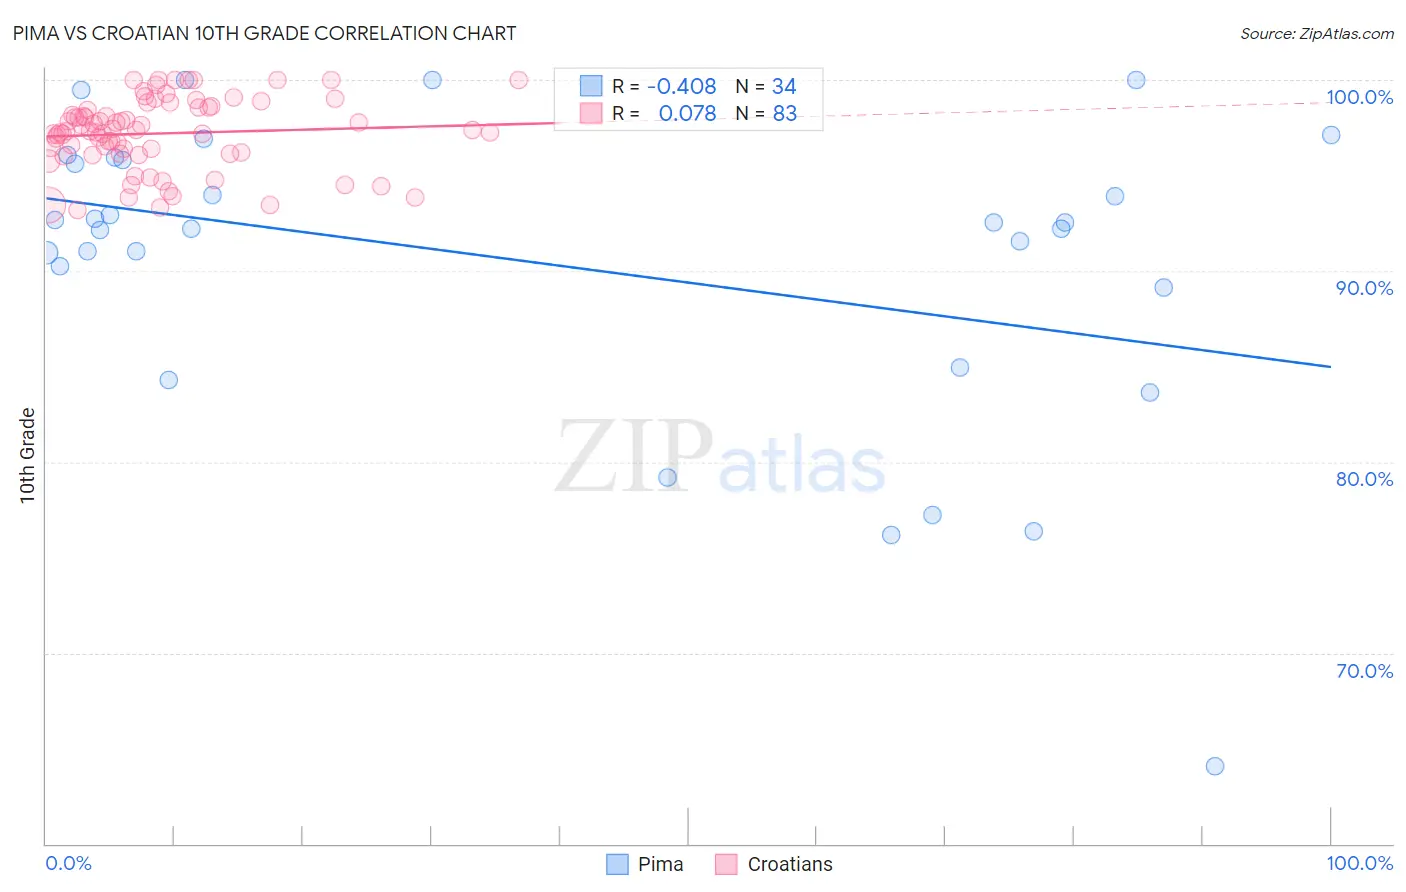
Pima vs Croatian 10th Grade Correlation Chart
The statistical analysis conducted on geographies consisting of 61,552,942 people shows a moderate negative correlation between the proportion of Pima and percentage of population with at least 10th grade education in the United States with a correlation coefficient (R) of -0.408 and weighted average of 91.2%. Similarly, the statistical analysis conducted on geographies consisting of 375,734,264 people shows a slight positive correlation between the proportion of Croatians and percentage of population with at least 10th grade education in the United States with a correlation coefficient (R) of 0.078 and weighted average of 95.7%, a difference of 5.0%.
10th Grade Correlation Summary
| Measurement | Pima | Croatian |
| Minimum | 64.0% | 93.2% |
| Maximum | 100.0% | 100.0% |
| Range | 36.0% | 6.8% |
| Mean | 90.4% | 97.2% |
| Median | 92.4% | 97.3% |
| Interquartile 25% (IQ1) | 89.1% | 96.2% |
| Interquartile 75% (IQ3) | 95.8% | 98.6% |
| Interquartile Range (IQR) | 6.7% | 2.4% |
| Standard Deviation (Sample) | 8.0% | 1.8% |
| Standard Deviation (Population) | 7.9% | 1.8% |
Similar Demographics by 10th Grade
Demographics Similar to Pima by 10th Grade
In terms of 10th grade, the demographic groups most similar to Pima are Immigrants from Dominica (91.1%, a difference of 0.020%), Immigrants from Vietnam (91.2%, a difference of 0.060%), Japanese (91.2%, a difference of 0.080%), Immigrants from Guyana (91.2%, a difference of 0.080%), and Yaqui (91.1%, a difference of 0.080%).
| Demographics | Rating | Rank | 10th Grade |
| Fijians | 0.0 /100 | #297 | Tragic 91.5% |
| Cubans | 0.0 /100 | #298 | Tragic 91.5% |
| Immigrants | Haiti | 0.0 /100 | #299 | Tragic 91.4% |
| Guyanese | 0.0 /100 | #300 | Tragic 91.4% |
| Japanese | 0.0 /100 | #301 | Tragic 91.2% |
| Immigrants | Guyana | 0.0 /100 | #302 | Tragic 91.2% |
| Immigrants | Vietnam | 0.0 /100 | #303 | Tragic 91.2% |
| Pima | 0.0 /100 | #304 | Tragic 91.2% |
| Immigrants | Dominica | 0.0 /100 | #305 | Tragic 91.1% |
| Yaqui | 0.0 /100 | #306 | Tragic 91.1% |
| Immigrants | Fiji | 0.0 /100 | #307 | Tragic 91.0% |
| Immigrants | Bangladesh | 0.0 /100 | #308 | Tragic 91.0% |
| Immigrants | Immigrants | 0.0 /100 | #309 | Tragic 91.0% |
| Vietnamese | 0.0 /100 | #310 | Tragic 90.9% |
| Immigrants | Cambodia | 0.0 /100 | #311 | Tragic 90.9% |
Demographics Similar to Croatians by 10th Grade
In terms of 10th grade, the demographic groups most similar to Croatians are Finnish (95.8%, a difference of 0.020%), Danish (95.7%, a difference of 0.040%), Lithuanian (95.8%, a difference of 0.080%), Tlingit-Haida (95.7%, a difference of 0.080%), and German (95.8%, a difference of 0.090%).
| Demographics | Rating | Rank | 10th Grade |
| Slovenes | 100.0 /100 | #3 | Exceptional 95.9% |
| Swedes | 100.0 /100 | #4 | Exceptional 95.9% |
| Carpatho Rusyns | 100.0 /100 | #5 | Exceptional 95.9% |
| Poles | 100.0 /100 | #6 | Exceptional 95.8% |
| Germans | 100.0 /100 | #7 | Exceptional 95.8% |
| Lithuanians | 100.0 /100 | #8 | Exceptional 95.8% |
| Finns | 100.0 /100 | #9 | Exceptional 95.8% |
| Croatians | 100.0 /100 | #10 | Exceptional 95.7% |
| Danes | 100.0 /100 | #11 | Exceptional 95.7% |
| Tlingit-Haida | 100.0 /100 | #12 | Exceptional 95.7% |
| English | 100.0 /100 | #13 | Exceptional 95.6% |
| Tsimshian | 100.0 /100 | #14 | Exceptional 95.6% |
| Irish | 100.0 /100 | #15 | Exceptional 95.6% |
| Scottish | 100.0 /100 | #16 | Exceptional 95.6% |
| Latvians | 100.0 /100 | #17 | Exceptional 95.6% |