Pima vs Immigrants from Central America 10th Grade
COMPARE
Pima
Immigrants from Central America
10th Grade
10th Grade Comparison
Pima
Immigrants from Central America
91.2%
10TH GRADE
0.0/ 100
METRIC RATING
304th/ 347
METRIC RANK
86.6%
10TH GRADE
0.0/ 100
METRIC RATING
345th/ 347
METRIC RANK
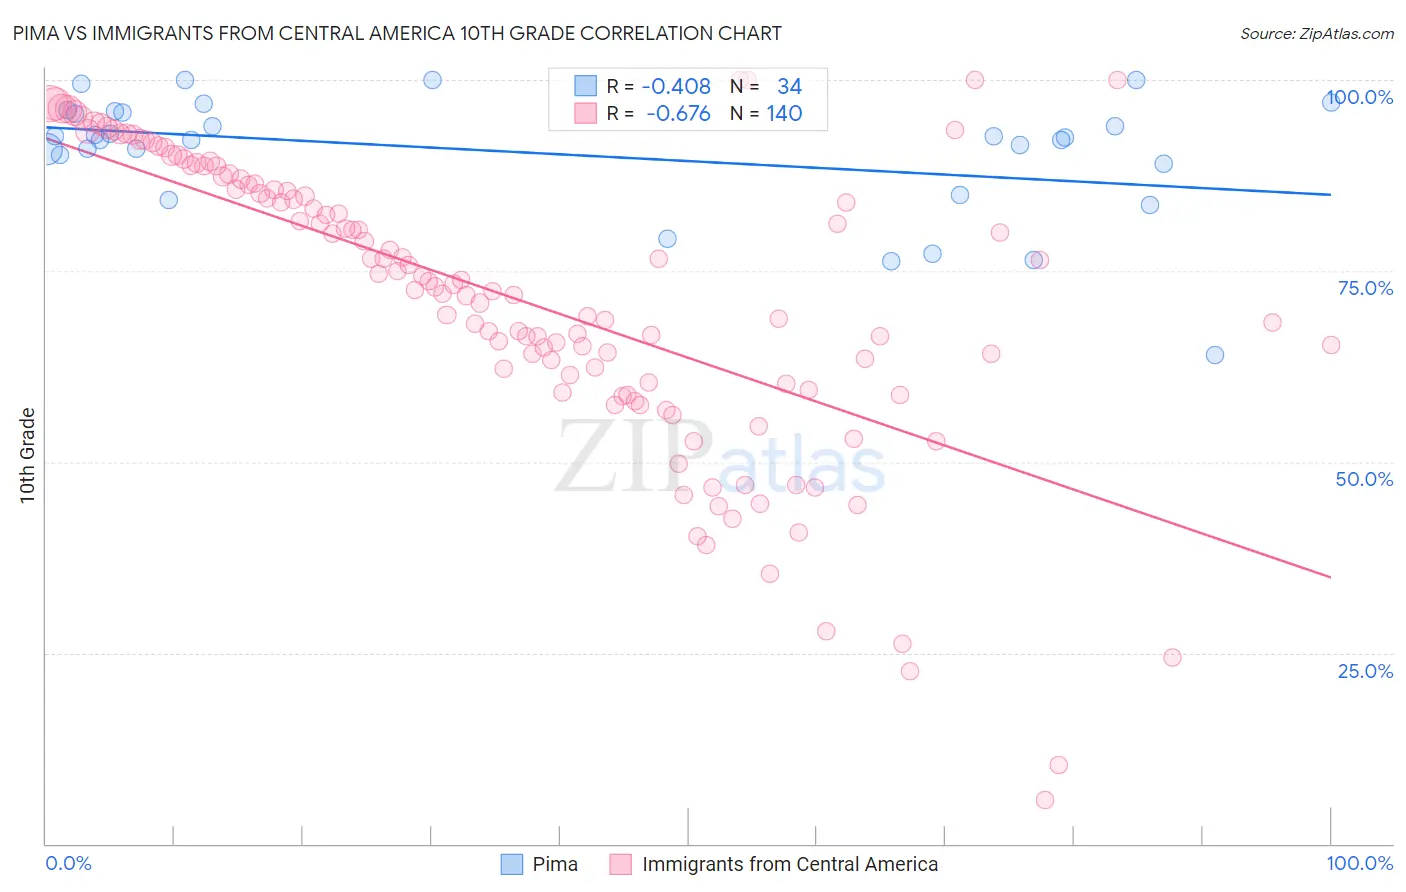
Pima vs Immigrants from Central America 10th Grade Correlation Chart
The statistical analysis conducted on geographies consisting of 61,552,942 people shows a moderate negative correlation between the proportion of Pima and percentage of population with at least 10th grade education in the United States with a correlation coefficient (R) of -0.408 and weighted average of 91.2%. Similarly, the statistical analysis conducted on geographies consisting of 536,553,521 people shows a significant negative correlation between the proportion of Immigrants from Central America and percentage of population with at least 10th grade education in the United States with a correlation coefficient (R) of -0.676 and weighted average of 86.6%, a difference of 5.3%.
10th Grade Correlation Summary
| Measurement | Pima | Immigrants from Central America |
| Minimum | 64.0% | 5.7% |
| Maximum | 100.0% | 100.0% |
| Range | 36.0% | 94.3% |
| Mean | 90.4% | 71.5% |
| Median | 92.4% | 73.5% |
| Interquartile 25% (IQ1) | 89.1% | 60.3% |
| Interquartile 75% (IQ3) | 95.8% | 86.7% |
| Interquartile Range (IQR) | 6.7% | 26.4% |
| Standard Deviation (Sample) | 8.0% | 19.3% |
| Standard Deviation (Population) | 7.9% | 19.3% |
Similar Demographics by 10th Grade
Demographics Similar to Pima by 10th Grade
In terms of 10th grade, the demographic groups most similar to Pima are Immigrants from Dominica (91.1%, a difference of 0.020%), Immigrants from Vietnam (91.2%, a difference of 0.060%), Japanese (91.2%, a difference of 0.080%), Immigrants from Guyana (91.2%, a difference of 0.080%), and Yaqui (91.1%, a difference of 0.080%).
| Demographics | Rating | Rank | 10th Grade |
| Fijians | 0.0 /100 | #297 | Tragic 91.5% |
| Cubans | 0.0 /100 | #298 | Tragic 91.5% |
| Immigrants | Haiti | 0.0 /100 | #299 | Tragic 91.4% |
| Guyanese | 0.0 /100 | #300 | Tragic 91.4% |
| Japanese | 0.0 /100 | #301 | Tragic 91.2% |
| Immigrants | Guyana | 0.0 /100 | #302 | Tragic 91.2% |
| Immigrants | Vietnam | 0.0 /100 | #303 | Tragic 91.2% |
| Pima | 0.0 /100 | #304 | Tragic 91.2% |
| Immigrants | Dominica | 0.0 /100 | #305 | Tragic 91.1% |
| Yaqui | 0.0 /100 | #306 | Tragic 91.1% |
| Immigrants | Fiji | 0.0 /100 | #307 | Tragic 91.0% |
| Immigrants | Bangladesh | 0.0 /100 | #308 | Tragic 91.0% |
| Immigrants | Immigrants | 0.0 /100 | #309 | Tragic 91.0% |
| Vietnamese | 0.0 /100 | #310 | Tragic 90.9% |
| Immigrants | Cambodia | 0.0 /100 | #311 | Tragic 90.9% |
Demographics Similar to Immigrants from Central America by 10th Grade
In terms of 10th grade, the demographic groups most similar to Immigrants from Central America are Immigrants from El Salvador (86.8%, a difference of 0.18%), Yakama (86.9%, a difference of 0.32%), Spanish American Indian (86.2%, a difference of 0.45%), Immigrants from Mexico (86.2%, a difference of 0.47%), and Immigrants from Guatemala (87.4%, a difference of 0.90%).
| Demographics | Rating | Rank | 10th Grade |
| Hondurans | 0.0 /100 | #333 | Tragic 89.0% |
| Hispanics or Latinos | 0.0 /100 | #334 | Tragic 88.9% |
| Immigrants | Dominican Republic | 0.0 /100 | #335 | Tragic 88.7% |
| Immigrants | Honduras | 0.0 /100 | #336 | Tragic 88.5% |
| Central Americans | 0.0 /100 | #337 | Tragic 88.4% |
| Immigrants | Latin America | 0.0 /100 | #338 | Tragic 88.3% |
| Guatemalans | 0.0 /100 | #339 | Tragic 87.9% |
| Mexicans | 0.0 /100 | #340 | Tragic 87.8% |
| Salvadorans | 0.0 /100 | #341 | Tragic 87.5% |
| Immigrants | Guatemala | 0.0 /100 | #342 | Tragic 87.4% |
| Yakama | 0.0 /100 | #343 | Tragic 86.9% |
| Immigrants | El Salvador | 0.0 /100 | #344 | Tragic 86.8% |
| Immigrants | Central America | 0.0 /100 | #345 | Tragic 86.6% |
| Spanish American Indians | 0.0 /100 | #346 | Tragic 86.2% |
| Immigrants | Mexico | 0.0 /100 | #347 | Tragic 86.2% |