White/Caucasian vs Immigrants from Chile High School Diploma

COMPARE

White/Caucasian
Race
Ancestry
AfghanAfricanAlaska NativeAlaskan AthabascanAlbanianAleutAlsatianAmericanApacheArabArapahoArgentineanArmenianAssyrian/Chaldean/SyriacAustralianAustrianBahamianBangladeshiBarbadianBasqueBelgianBelizeanBermudanBhutaneseBlackfeetBolivianBrazilianBritishBritish West IndianBulgarianBurmeseCajunCambodianCanadianCape VerdeanCarpatho RusynCelticCentral AmericanCentral American IndianCherokeeCheyenneChickasawChileanChineseChippewaChoctawColombianColvilleComancheCosta RicanCreeCreekCroatianCrowCubanCypriotCzechCzechoslovakianDanishDelawareDominicanDutchDutch West IndianEastern EuropeanEcuadorianEgyptianEnglishEstonianEthiopianEuropeanFijianFilipinoFinnishFrenchFrench American IndianFrench CanadianGermanGerman RussianGhanaianGreekGuamanian/ChamorroGuatemalanGuyaneseHaitianHmongHonduranHopiHoumaHungarianIcelanderIndian (Asian)IndonesianInupiatIranianIraqiIrishIroquoisIsraeliItalianJamaicanJapaneseJordanianKenyanKiowaKoreanLaotianLatvianLebaneseLiberianLithuanianLumbeeLuxembourgerMacedonianMalaysianMalteseMarshalleseMenomineeMexicanMexican American IndianMongolianMoroccanNative HawaiianNavajoNepaleseNew ZealanderNicaraguanNigerianNorthern EuropeanNorwegianOkinawanOsageOttawaPaiutePakistaniPalestinianPanamanianParaguayanPennsylvania GermanPeruvianPimaPolishPortuguesePotawatomiPuebloPuerto RicanPuget Sound SalishRomanianRussianSalvadoranSamoanScandinavianScotch-IrishScottishSeminoleSenegaleseSerbianShoshoneSierra LeoneanSiouxSlavicSlovakSloveneSomaliSouth AfricanSouth AmericanSouth American IndianSoviet UnionSpaniardSpanishSpanish AmericanSpanish American IndianSri LankanSubsaharan AfricanSudaneseSwedishSwissSyrianTaiwaneseThaiTlingit-HaidaTohono O'OdhamTonganTrinidadian and TobagonianTsimshianTurkishU.S. Virgin IslanderUgandanUkrainianUruguayanUteVenezuelanVietnameseWelshWest IndianYakamaYaquiYugoslavianYumanYup'ikZimbabwean
Immigration
NonimmigrantsImmigrantsAfghanistanAfricaAlbaniaArgentinaArmeniaAsiaAustraliaAustriaBahamasBangladeshBarbadosBelarusBelgiumBelizeBoliviaBosnia and HerzegovinaBrazilBulgariaBurma/MyanmarCabo VerdeCambodiaCameroonCanadaCaribbeanCentral AmericaChinaColombiaCongoCosta RicaCroatiaCubaCzechoslovakiaDenmarkDominicaDominican RepublicEastern AfricaEastern AsiaEastern EuropeEcuadorEgyptEl SalvadorEnglandEritreaEthiopiaEuropeFijiFranceGermanyGhanaGreeceGrenadaGuatemalaGuyanaHaitiHondurasHong KongHungaryIndiaIndonesiaIranIraqIrelandIsraelItalyJamaicaJapanJordanKazakhstanKenyaKoreaKuwaitLaosLatin AmericaLatviaLebanonLiberiaLithuaniaMalaysiaMexicoMicronesiaMiddle AfricaMoldovaMoroccoNepalNetherlandsNicaraguaNigeriaNorth AmericaNorth MacedoniaNorthern AfricaNorthern EuropeNorwayOceaniaPakistanPanamaPeruPhilippinesPolandPortugalRomaniaRussiaSaudi ArabiaScotlandSenegalSerbiaSierra LeoneSingaporeSomaliaSouth AfricaSouth AmericaSouth Central AsiaSouth Eastern AsiaSouthern EuropeSpainSri LankaSt. Vincent and the GrenadinesSudanSwedenSwitzerlandSyriaTaiwanThailandTrinidad and TobagoTurkeyUgandaUkraineUruguayUzbekistanVenezuelaVietnamWest IndiesWestern AfricaWestern AsiaWestern EuropeYemenZaireZimbabweAzores
Immigrants from Chile
Race
Ancestry
AfghanAfricanAlaska NativeAlaskan AthabascanAlbanianAleutAlsatianAmericanApacheArabArapahoArgentineanArmenianAssyrian/Chaldean/SyriacAustralianAustrianBahamianBangladeshiBarbadianBasqueBelgianBelizeanBermudanBhutaneseBlackfeetBolivianBrazilianBritishBritish West IndianBulgarianBurmeseCajunCambodianCanadianCape VerdeanCarpatho RusynCelticCentral AmericanCentral American IndianCherokeeCheyenneChickasawChileanChineseChippewaChoctawColombianColvilleComancheCosta RicanCreeCreekCroatianCrowCubanCypriotCzechCzechoslovakianDanishDelawareDominicanDutchDutch West IndianEastern EuropeanEcuadorianEgyptianEnglishEstonianEthiopianEuropeanFijianFilipinoFinnishFrenchFrench American IndianFrench CanadianGermanGerman RussianGhanaianGreekGuamanian/ChamorroGuatemalanGuyaneseHaitianHmongHonduranHopiHoumaHungarianIcelanderIndian (Asian)IndonesianInupiatIranianIraqiIrishIroquoisIsraeliItalianJamaicanJapaneseJordanianKenyanKiowaKoreanLaotianLatvianLebaneseLiberianLithuanianLumbeeLuxembourgerMacedonianMalaysianMalteseMarshalleseMenomineeMexicanMexican American IndianMongolianMoroccanNative HawaiianNavajoNepaleseNew ZealanderNicaraguanNigerianNorthern EuropeanNorwegianOkinawanOsageOttawaPaiutePakistaniPalestinianPanamanianParaguayanPennsylvania GermanPeruvianPimaPolishPortuguesePotawatomiPuebloPuerto RicanPuget Sound SalishRomanianRussianSalvadoranSamoanScandinavianScotch-IrishScottishSeminoleSenegaleseSerbianShoshoneSierra LeoneanSiouxSlavicSlovakSloveneSomaliSouth AfricanSouth AmericanSouth American IndianSoviet UnionSpaniardSpanishSpanish AmericanSpanish American IndianSri LankanSubsaharan AfricanSudaneseSwedishSwissSyrianTaiwaneseThaiTlingit-HaidaTohono O'OdhamTonganTrinidadian and TobagonianTsimshianTurkishU.S. Virgin IslanderUgandanUkrainianUruguayanUteVenezuelanVietnameseWelshWest IndianYakamaYaquiYugoslavianYumanYup'ikZimbabwean
Immigration
NonimmigrantsImmigrantsAfghanistanAfricaAlbaniaArgentinaArmeniaAsiaAustraliaAustriaBahamasBangladeshBarbadosBelarusBelgiumBelizeBoliviaBosnia and HerzegovinaBrazilBulgariaBurma/MyanmarCabo VerdeCambodiaCameroonCanadaCaribbeanCentral AmericaChileChinaColombiaCongoCosta RicaCroatiaCubaCzechoslovakiaDenmarkDominicaDominican RepublicEastern AfricaEastern AsiaEastern EuropeEcuadorEgyptEl SalvadorEnglandEritreaEthiopiaEuropeFijiFranceGermanyGhanaGreeceGrenadaGuatemalaGuyanaHaitiHondurasHong KongHungaryIndiaIndonesiaIranIraqIrelandIsraelItalyJamaicaJapanJordanKazakhstanKenyaKoreaKuwaitLaosLatin AmericaLatviaLebanonLiberiaLithuaniaMalaysiaMexicoMicronesiaMiddle AfricaMoldovaMoroccoNepalNetherlandsNicaraguaNigeriaNorth AmericaNorth MacedoniaNorthern AfricaNorthern EuropeNorwayOceaniaPakistanPanamaPeruPhilippinesPolandPortugalRomaniaRussiaSaudi ArabiaScotlandSenegalSerbiaSierra LeoneSingaporeSomaliaSouth AfricaSouth AmericaSouth Central AsiaSouth Eastern AsiaSouthern EuropeSpainSri LankaSt. Vincent and the GrenadinesSudanSwedenSwitzerlandSyriaTaiwanThailandTrinidad and TobagoTurkeyUgandaUkraineUruguayUzbekistanVenezuelaVietnamWest IndiesWestern AfricaWestern AsiaWestern EuropeYemenZaireZimbabweAzores
High School Diploma
Income
Poverty
Unemployment
Labor Participation
Family Structure
Vehicle Availability
Education Level
Disability

High School Diploma Comparison

Whites/Caucasians

Immigrants from Chile

Exceptional
Fair
90.1%
HIGH SCHOOL DIPLOMA
94.1/ 100
METRIC RATING
121st/ 347
METRIC RANK
88.9%
HIGH SCHOOL DIPLOMA
31.9/ 100
METRIC RATING
190th/ 347
METRIC RANK

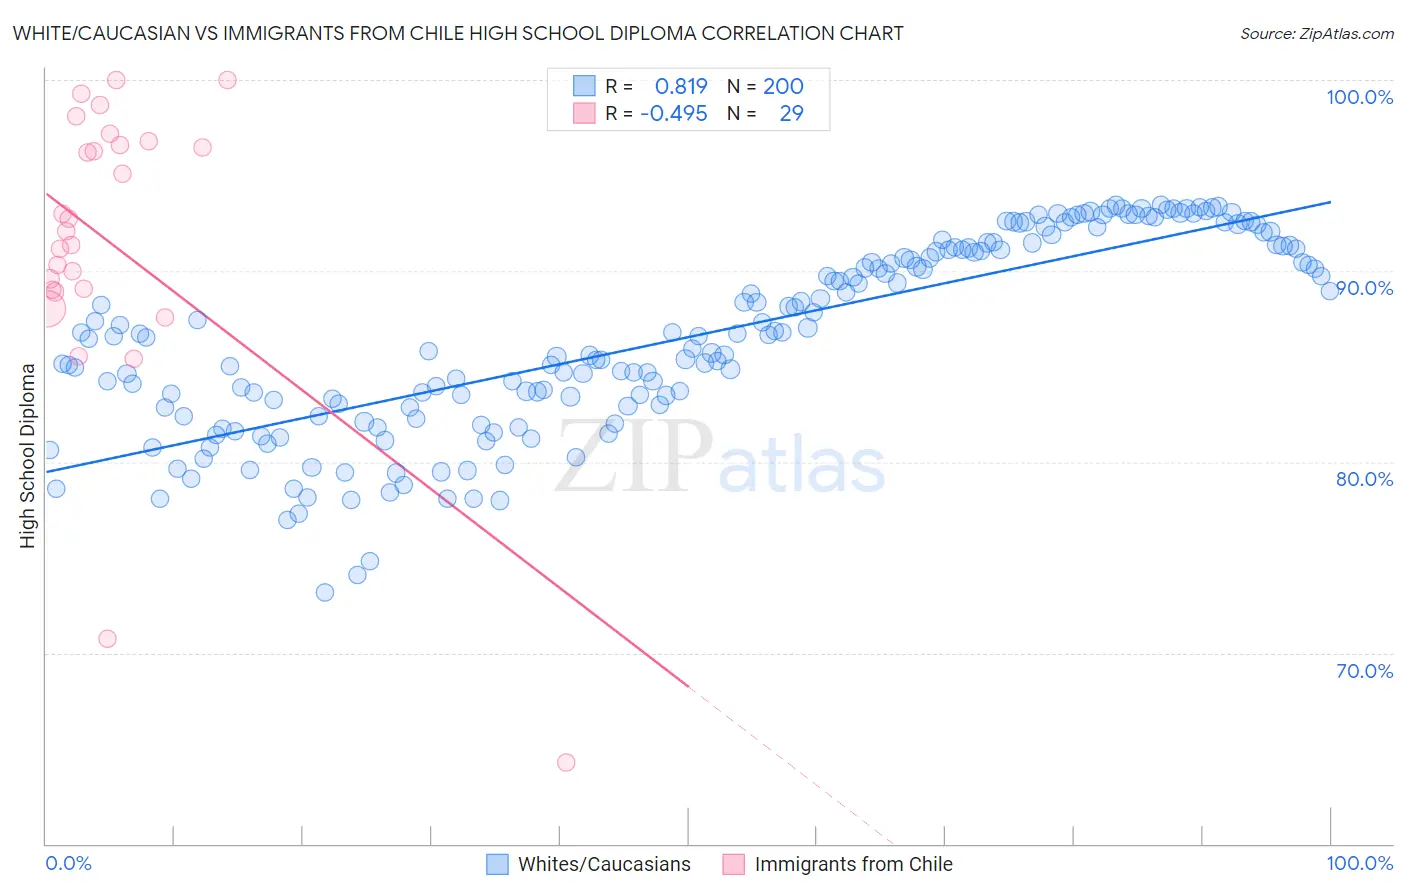
White/Caucasian vs Immigrants from Chile High School Diploma Correlation Chart

The statistical analysis conducted on geographies consisting of 585,242,062 people shows a very strong positive correlation between the proportion of Whites/Caucasians and percentage of population with at least high school diploma education in the United States with a correlation coefficient (R) of 0.819 and weighted average of 90.1%. Similarly, the statistical analysis conducted on geographies consisting of 218,647,266 people shows a moderate negative correlation between the proportion of Immigrants from Chile and percentage of population with at least high school diploma education in the United States with a correlation coefficient (R) of -0.495 and weighted average of 88.9%, a difference of 1.3%.
White/Caucasian vs Immigrants from Chile High School Diploma

High School Diploma Correlation Summary

MeasurementWhite/CaucasianImmigrants from Chile
Minimum73.2%64.3%
Maximum93.5%100.0%
Range20.3%35.7%
Mean86.5%91.4%
Median86.6%92.1%
Interquartile 25% (IQ1)82.9%89.0%
Interquartile 75% (IQ3)91.2%96.7%
Interquartile Range (IQR)8.3%7.7%
Standard Deviation (Sample)5.0%8.0%
Standard Deviation (Population)5.0%7.8%

Similar Demographics by High School Diploma

Demographics Similar to Whites/Caucasians by High School Diploma

In terms of high school diploma, the demographic groups most similar to Whites/Caucasians are Ottawa (90.1%, a difference of 0.020%), Immigrants from Kazakhstan (90.0%, a difference of 0.050%), Immigrants from Eastern Europe (90.1%, a difference of 0.060%), Israeli (90.1%, a difference of 0.070%), and Jordanian (90.2%, a difference of 0.10%).
DemographicsRating | RankHigh School Diploma
Yugoslavians
96.2
/100
|
#114
Exceptional
90.2%
Immigrants | Hungary
95.8
/100
|
#115
Exceptional
90.2%
Immigrants | Germany
95.7
/100
|
#116
Exceptional
90.2%
Jordanians
95.4
/100
|
#117
Exceptional
90.2%
Israelis
95.1
/100
|
#118
Exceptional
90.1%
Immigrants | Eastern Europe
94.9
/100
|
#119
Exceptional
90.1%
Ottawa
94.4
/100
|
#120
Exceptional
90.1%
Whites/Caucasians
94.1
/100
|
#121
Exceptional
90.1%
Immigrants | Kazakhstan
93.4
/100
|
#122
Exceptional
90.0%
German Russians
92.0
/100
|
#123
Exceptional
90.0%
Mongolians
91.6
/100
|
#124
Exceptional
89.9%
Egyptians
91.1
/100
|
#125
Exceptional
89.9%
Alaska Natives
91.0
/100
|
#126
Exceptional
89.9%
Immigrants | Eastern Asia
89.2
/100
|
#127
Excellent
89.9%
Puget Sound Salish
89.1
/100
|
#128
Excellent
89.9%

Demographics Similar to Immigrants from Chile by High School Diploma

In terms of high school diploma, the demographic groups most similar to Immigrants from Chile are Immigrants from Uganda (88.9%, a difference of 0.010%), Immigrants from Ethiopia (88.9%, a difference of 0.020%), Immigrants from Sudan (88.9%, a difference of 0.030%), Moroccan (88.8%, a difference of 0.040%), and Guamanian/Chamorro (88.9%, a difference of 0.060%).
DemographicsRating | RankHigh School Diploma
Potawatomi
42.5
/100
|
#183
Average
89.0%
Immigrants | Syria
39.2
/100
|
#184
Fair
89.0%
Ethiopians
37.0
/100
|
#185
Fair
89.0%
Immigrants | Eastern Africa
35.8
/100
|
#186
Fair
88.9%
Guamanians/Chamorros
35.5
/100
|
#187
Fair
88.9%
Immigrants | Sudan
33.4
/100
|
#188
Fair
88.9%
Immigrants | Uganda
32.6
/100
|
#189
Fair
88.9%
Immigrants | Chile
31.9
/100
|
#190
Fair
88.9%
Immigrants | Ethiopia
30.9
/100
|
#191
Fair
88.9%
Moroccans
29.5
/100
|
#192
Fair
88.8%
Immigrants | Oceania
26.9
/100
|
#193
Fair
88.8%
Immigrants | Venezuela
25.8
/100
|
#194
Fair
88.8%
Afghans
23.9
/100
|
#195
Fair
88.8%
Immigrants | Southern Europe
23.4
/100
|
#196
Fair
88.7%
French American Indians
21.5
/100
|
#197
Fair
88.7%