Pima vs Immigrants from Chile Average Family Size
COMPARE
Pima
Immigrants from Chile
Average Family Size
Average Family Size Comparison
Pima
Immigrants from Chile
3.75
AVERAGE FAMILY SIZE
100/ 100
METRIC RATING
4th/ 347
METRIC RANK
3.24
AVERAGE FAMILY SIZE
63.2/ 100
METRIC RATING
161st/ 347
METRIC RANK
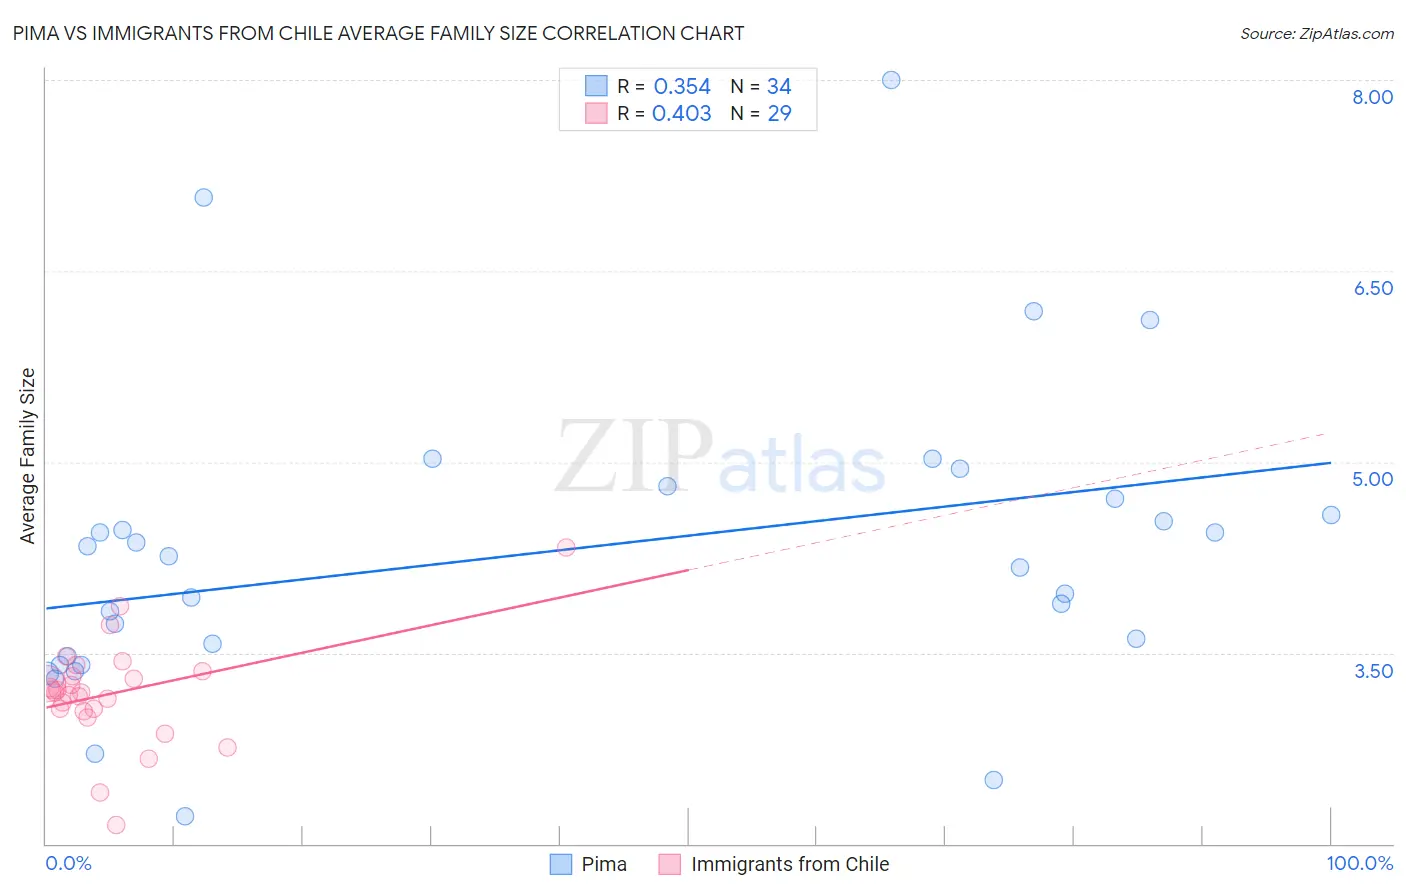
Pima vs Immigrants from Chile Average Family Size Correlation Chart
The statistical analysis conducted on geographies consisting of 61,539,566 people shows a mild positive correlation between the proportion of Pima and average family size in the United States with a correlation coefficient (R) of 0.354 and weighted average of 3.75. Similarly, the statistical analysis conducted on geographies consisting of 218,601,267 people shows a moderate positive correlation between the proportion of Immigrants from Chile and average family size in the United States with a correlation coefficient (R) of 0.403 and weighted average of 3.24, a difference of 15.8%.
Average Family Size Correlation Summary
| Measurement | Pima | Immigrants from Chile |
| Minimum | 2.22 | 2.15 |
| Maximum | 8.00 | 4.33 |
| Range | 5.78 | 2.18 |
| Mean | 4.29 | 3.18 |
| Median | 4.21 | 3.19 |
| Interquartile 25% (IQ1) | 3.48 | 3.05 |
| Interquartile 75% (IQ3) | 4.71 | 3.34 |
| Interquartile Range (IQR) | 1.23 | 0.29 |
| Standard Deviation (Sample) | 1.20 | 0.41 |
| Standard Deviation (Population) | 1.18 | 0.40 |
Similar Demographics by Average Family Size
Demographics Similar to Pima by Average Family Size
In terms of average family size, the demographic groups most similar to Pima are Pueblo (3.79, a difference of 1.3%), Crow (3.82, a difference of 2.1%), Navajo (3.65, a difference of 2.8%), Arapaho (3.64, a difference of 3.1%), and Inupiat (3.63, a difference of 3.3%).
| Demographics | Rating | Rank | Average Family Size |
| Yup'ik | 100 /100 | #1 | Exceptional 4.00 |
| Crow | 100 /100 | #2 | Exceptional 3.82 |
| Pueblo | 100 /100 | #3 | Exceptional 3.79 |
| Pima | 100 /100 | #4 | Exceptional 3.75 |
| Navajo | 100.0 /100 | #5 | Exceptional 3.65 |
| Arapaho | 100.0 /100 | #6 | Exceptional 3.64 |
| Inupiat | 100.0 /100 | #7 | Exceptional 3.63 |
| Immigrants | Yemen | 100.0 /100 | #8 | Exceptional 3.60 |
| Hopi | 100.0 /100 | #9 | Exceptional 3.60 |
| Spanish American Indians | 100.0 /100 | #10 | Exceptional 3.58 |
| Tohono O'odham | 100.0 /100 | #11 | Exceptional 3.53 |
| Immigrants | Mexico | 100.0 /100 | #12 | Exceptional 3.52 |
| Sioux | 100.0 /100 | #13 | Exceptional 3.52 |
| Immigrants | Central America | 100.0 /100 | #14 | Exceptional 3.49 |
| Tongans | 100.0 /100 | #15 | Exceptional 3.49 |
Demographics Similar to Immigrants from Chile by Average Family Size
In terms of average family size, the demographic groups most similar to Immigrants from Chile are Ethiopian (3.24, a difference of 0.010%), Immigrants from Iraq (3.24, a difference of 0.010%), Iraqi (3.24, a difference of 0.020%), Immigrants from Uganda (3.23, a difference of 0.060%), and Immigrants from Uzbekistan (3.24, a difference of 0.080%).
| Demographics | Rating | Rank | Average Family Size |
| Immigrants | Egypt | 70.0 /100 | #154 | Good 3.24 |
| Seminole | 68.2 /100 | #155 | Good 3.24 |
| Immigrants | Taiwan | 68.1 /100 | #156 | Good 3.24 |
| Immigrants | Uzbekistan | 67.0 /100 | #157 | Good 3.24 |
| Iraqis | 64.3 /100 | #158 | Good 3.24 |
| Ethiopians | 63.9 /100 | #159 | Good 3.24 |
| Immigrants | Iraq | 63.7 /100 | #160 | Good 3.24 |
| Immigrants | Chile | 63.2 /100 | #161 | Good 3.24 |
| Immigrants | Uganda | 60.1 /100 | #162 | Good 3.23 |
| Uruguayans | 58.8 /100 | #163 | Average 3.23 |
| Egyptians | 58.6 /100 | #164 | Average 3.23 |
| Ugandans | 58.4 /100 | #165 | Average 3.23 |
| Immigrants | Senegal | 57.5 /100 | #166 | Average 3.23 |
| Dutch West Indians | 56.9 /100 | #167 | Average 3.23 |
| Taiwanese | 54.2 /100 | #168 | Average 3.23 |