Ecuadorian vs Immigrants from Chile High School Diploma
COMPARE
Ecuadorian
Immigrants from Chile
High School Diploma
High School Diploma Comparison
Ecuadorians
Immigrants from Chile
85.1%
HIGH SCHOOL DIPLOMA
0.0/ 100
METRIC RATING
311th/ 347
METRIC RANK
88.9%
HIGH SCHOOL DIPLOMA
31.9/ 100
METRIC RATING
190th/ 347
METRIC RANK
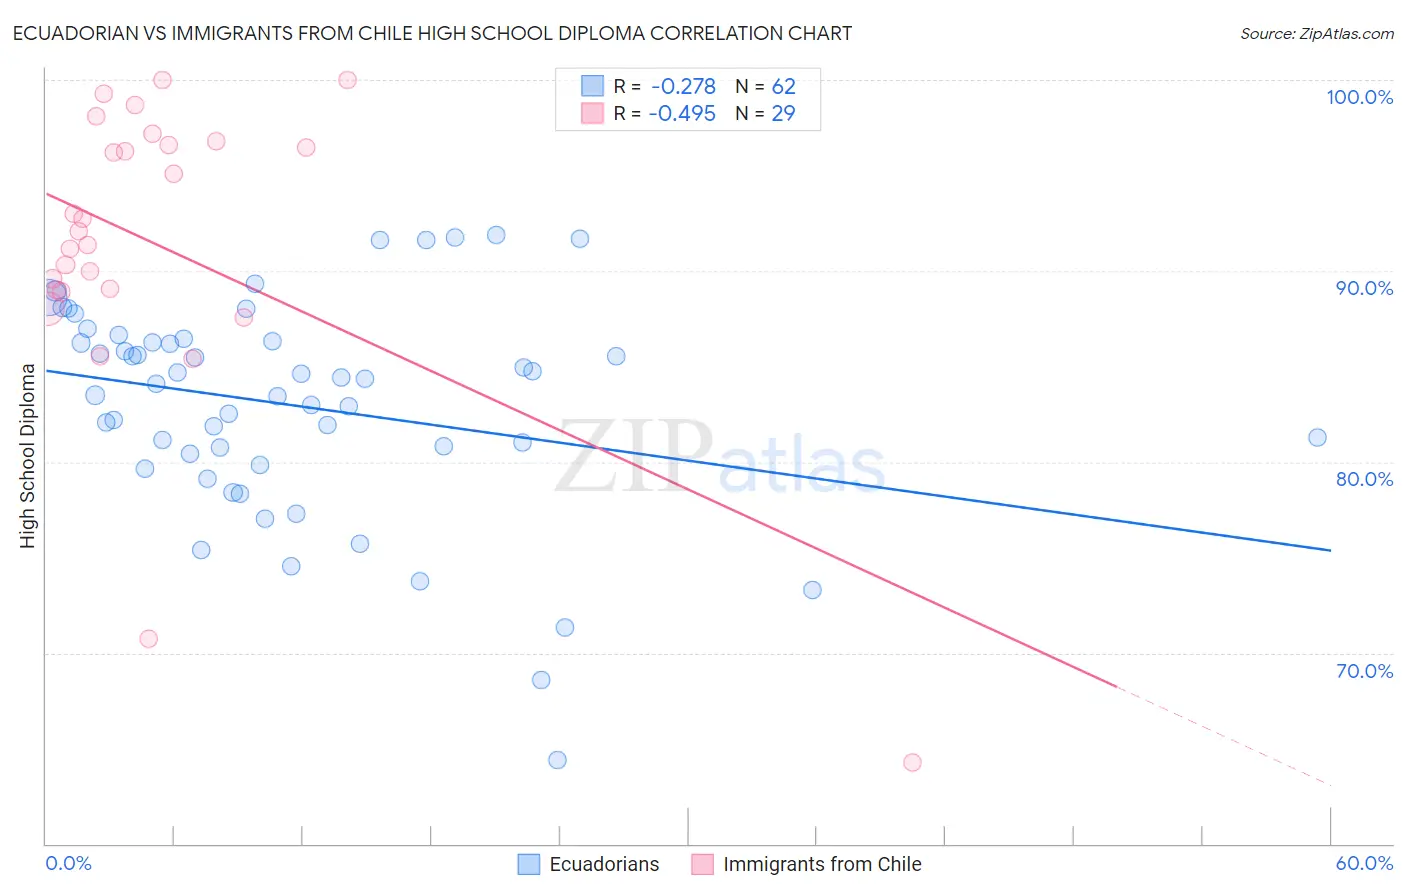
Ecuadorian vs Immigrants from Chile High School Diploma Correlation Chart
The statistical analysis conducted on geographies consisting of 317,865,755 people shows a weak negative correlation between the proportion of Ecuadorians and percentage of population with at least high school diploma education in the United States with a correlation coefficient (R) of -0.278 and weighted average of 85.1%. Similarly, the statistical analysis conducted on geographies consisting of 218,647,266 people shows a moderate negative correlation between the proportion of Immigrants from Chile and percentage of population with at least high school diploma education in the United States with a correlation coefficient (R) of -0.495 and weighted average of 88.9%, a difference of 4.5%.
High School Diploma Correlation Summary
| Measurement | Ecuadorian | Immigrants from Chile |
| Minimum | 64.4% | 64.3% |
| Maximum | 91.9% | 100.0% |
| Range | 27.5% | 35.7% |
| Mean | 83.0% | 91.4% |
| Median | 84.2% | 92.1% |
| Interquartile 25% (IQ1) | 80.4% | 89.0% |
| Interquartile 75% (IQ3) | 86.3% | 96.7% |
| Interquartile Range (IQR) | 5.9% | 7.7% |
| Standard Deviation (Sample) | 5.7% | 8.0% |
| Standard Deviation (Population) | 5.6% | 7.8% |
Similar Demographics by High School Diploma
Demographics Similar to Ecuadorians by High School Diploma
In terms of high school diploma, the demographic groups most similar to Ecuadorians are Apache (85.1%, a difference of 0.010%), Cape Verdean (85.1%, a difference of 0.050%), Immigrants from Dominica (85.2%, a difference of 0.090%), Immigrants from Armenia (85.2%, a difference of 0.10%), and Navajo (85.2%, a difference of 0.11%).
| Demographics | Rating | Rank | High School Diploma |
| Nepalese | 0.0 /100 | #304 | Tragic 85.3% |
| Immigrants | Portugal | 0.0 /100 | #305 | Tragic 85.3% |
| Immigrants | Guyana | 0.0 /100 | #306 | Tragic 85.3% |
| Navajo | 0.0 /100 | #307 | Tragic 85.2% |
| Immigrants | Armenia | 0.0 /100 | #308 | Tragic 85.2% |
| Immigrants | Dominica | 0.0 /100 | #309 | Tragic 85.2% |
| Apache | 0.0 /100 | #310 | Tragic 85.1% |
| Ecuadorians | 0.0 /100 | #311 | Tragic 85.1% |
| Cape Verdeans | 0.0 /100 | #312 | Tragic 85.1% |
| Immigrants | Ecuador | 0.0 /100 | #313 | Tragic 84.8% |
| Yaqui | 0.0 /100 | #314 | Tragic 84.7% |
| Puerto Ricans | 0.0 /100 | #315 | Tragic 84.7% |
| Belizeans | 0.0 /100 | #316 | Tragic 84.3% |
| Immigrants | Caribbean | 0.0 /100 | #317 | Tragic 84.3% |
| Immigrants | Belize | 0.0 /100 | #318 | Tragic 84.2% |
Demographics Similar to Immigrants from Chile by High School Diploma
In terms of high school diploma, the demographic groups most similar to Immigrants from Chile are Immigrants from Uganda (88.9%, a difference of 0.010%), Immigrants from Ethiopia (88.9%, a difference of 0.020%), Immigrants from Sudan (88.9%, a difference of 0.030%), Moroccan (88.8%, a difference of 0.040%), and Guamanian/Chamorro (88.9%, a difference of 0.060%).
| Demographics | Rating | Rank | High School Diploma |
| Potawatomi | 42.5 /100 | #183 | Average 89.0% |
| Immigrants | Syria | 39.2 /100 | #184 | Fair 89.0% |
| Ethiopians | 37.0 /100 | #185 | Fair 89.0% |
| Immigrants | Eastern Africa | 35.8 /100 | #186 | Fair 88.9% |
| Guamanians/Chamorros | 35.5 /100 | #187 | Fair 88.9% |
| Immigrants | Sudan | 33.4 /100 | #188 | Fair 88.9% |
| Immigrants | Uganda | 32.6 /100 | #189 | Fair 88.9% |
| Immigrants | Chile | 31.9 /100 | #190 | Fair 88.9% |
| Immigrants | Ethiopia | 30.9 /100 | #191 | Fair 88.9% |
| Moroccans | 29.5 /100 | #192 | Fair 88.8% |
| Immigrants | Oceania | 26.9 /100 | #193 | Fair 88.8% |
| Immigrants | Venezuela | 25.8 /100 | #194 | Fair 88.8% |
| Afghans | 23.9 /100 | #195 | Fair 88.8% |
| Immigrants | Southern Europe | 23.4 /100 | #196 | Fair 88.7% |
| French American Indians | 21.5 /100 | #197 | Fair 88.7% |