Sioux vs Immigrants from Chile High School Diploma
COMPARE
Sioux
Immigrants from Chile
High School Diploma
High School Diploma Comparison
Sioux
Immigrants from Chile
87.9%
HIGH SCHOOL DIPLOMA
2.7/ 100
METRIC RATING
238th/ 347
METRIC RANK
88.9%
HIGH SCHOOL DIPLOMA
31.9/ 100
METRIC RATING
190th/ 347
METRIC RANK
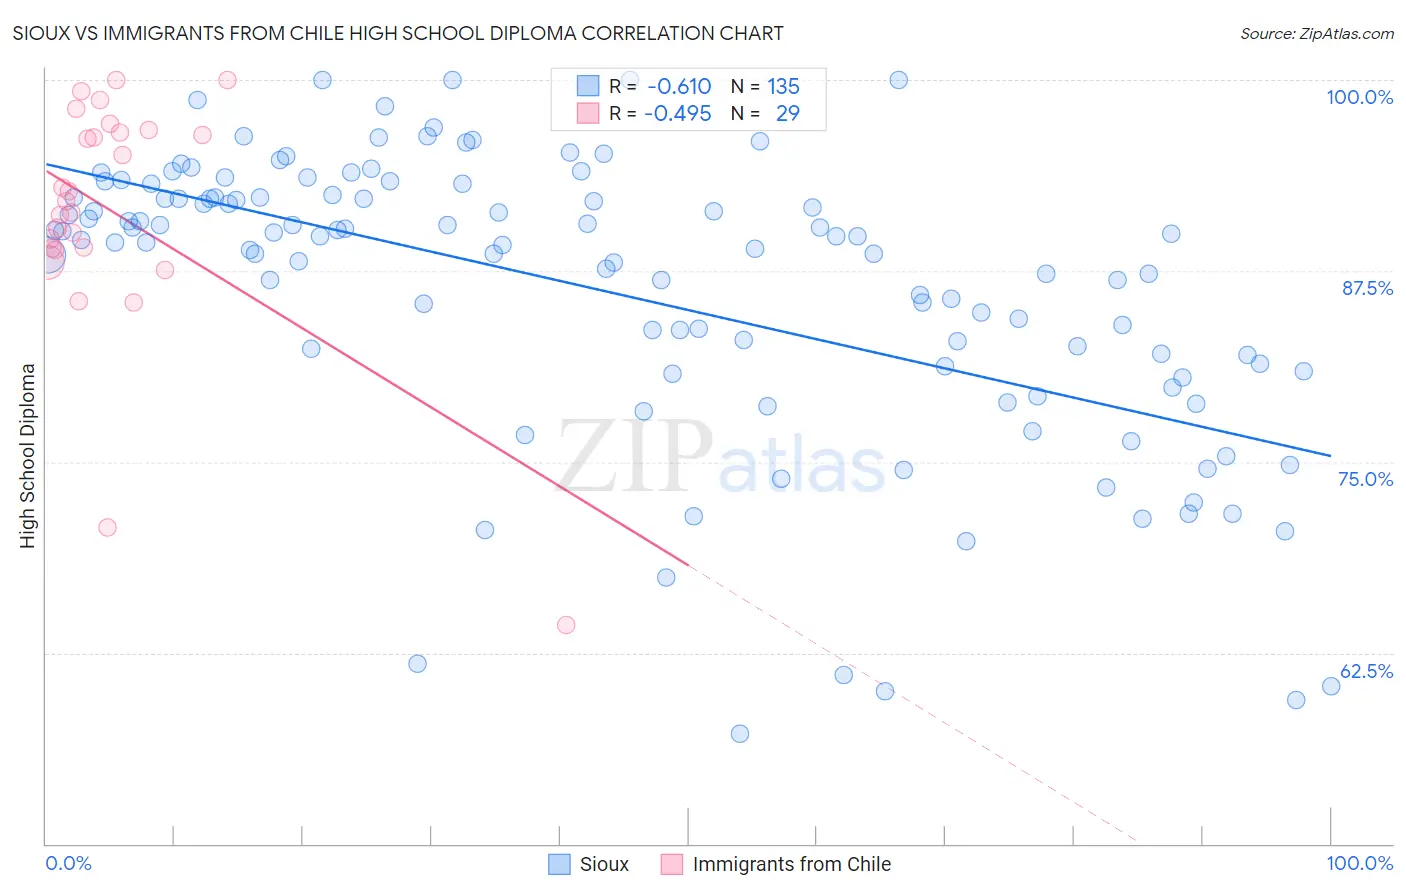
Sioux vs Immigrants from Chile High School Diploma Correlation Chart
The statistical analysis conducted on geographies consisting of 234,200,396 people shows a significant negative correlation between the proportion of Sioux and percentage of population with at least high school diploma education in the United States with a correlation coefficient (R) of -0.610 and weighted average of 87.9%. Similarly, the statistical analysis conducted on geographies consisting of 218,647,266 people shows a moderate negative correlation between the proportion of Immigrants from Chile and percentage of population with at least high school diploma education in the United States with a correlation coefficient (R) of -0.495 and weighted average of 88.9%, a difference of 1.1%.
High School Diploma Correlation Summary
| Measurement | Sioux | Immigrants from Chile |
| Minimum | 57.2% | 64.3% |
| Maximum | 100.0% | 100.0% |
| Range | 42.8% | 35.7% |
| Mean | 86.2% | 91.4% |
| Median | 89.4% | 92.1% |
| Interquartile 25% (IQ1) | 81.3% | 89.0% |
| Interquartile 75% (IQ3) | 92.3% | 96.7% |
| Interquartile Range (IQR) | 11.0% | 7.7% |
| Standard Deviation (Sample) | 9.4% | 8.0% |
| Standard Deviation (Population) | 9.4% | 7.8% |
Similar Demographics by High School Diploma
Demographics Similar to Sioux by High School Diploma
In terms of high school diploma, the demographic groups most similar to Sioux are Taiwanese (87.9%, a difference of 0.0%), South American (87.9%, a difference of 0.0%), Subsaharan African (87.9%, a difference of 0.010%), Immigrants from Bahamas (88.0%, a difference of 0.030%), and Immigrants from Panama (88.0%, a difference of 0.050%).
| Demographics | Rating | Rank | High School Diploma |
| Colombians | 3.8 /100 | #231 | Tragic 88.1% |
| Immigrants | Middle Africa | 3.4 /100 | #232 | Tragic 88.0% |
| Immigrants | Panama | 3.1 /100 | #233 | Tragic 88.0% |
| Immigrants | Thailand | 3.1 /100 | #234 | Tragic 88.0% |
| Immigrants | Bahamas | 2.9 /100 | #235 | Tragic 88.0% |
| Sub-Saharan Africans | 2.8 /100 | #236 | Tragic 87.9% |
| Taiwanese | 2.8 /100 | #237 | Tragic 87.9% |
| Sioux | 2.7 /100 | #238 | Tragic 87.9% |
| South Americans | 2.7 /100 | #239 | Tragic 87.9% |
| Comanche | 2.2 /100 | #240 | Tragic 87.9% |
| Immigrants | Uzbekistan | 2.1 /100 | #241 | Tragic 87.8% |
| Cheyenne | 2.1 /100 | #242 | Tragic 87.8% |
| Immigrants | Philippines | 1.9 /100 | #243 | Tragic 87.8% |
| Choctaw | 1.9 /100 | #244 | Tragic 87.8% |
| Peruvians | 1.9 /100 | #245 | Tragic 87.8% |
Demographics Similar to Immigrants from Chile by High School Diploma
In terms of high school diploma, the demographic groups most similar to Immigrants from Chile are Immigrants from Uganda (88.9%, a difference of 0.010%), Immigrants from Ethiopia (88.9%, a difference of 0.020%), Immigrants from Sudan (88.9%, a difference of 0.030%), Moroccan (88.8%, a difference of 0.040%), and Guamanian/Chamorro (88.9%, a difference of 0.060%).
| Demographics | Rating | Rank | High School Diploma |
| Potawatomi | 42.5 /100 | #183 | Average 89.0% |
| Immigrants | Syria | 39.2 /100 | #184 | Fair 89.0% |
| Ethiopians | 37.0 /100 | #185 | Fair 89.0% |
| Immigrants | Eastern Africa | 35.8 /100 | #186 | Fair 88.9% |
| Guamanians/Chamorros | 35.5 /100 | #187 | Fair 88.9% |
| Immigrants | Sudan | 33.4 /100 | #188 | Fair 88.9% |
| Immigrants | Uganda | 32.6 /100 | #189 | Fair 88.9% |
| Immigrants | Chile | 31.9 /100 | #190 | Fair 88.9% |
| Immigrants | Ethiopia | 30.9 /100 | #191 | Fair 88.9% |
| Moroccans | 29.5 /100 | #192 | Fair 88.8% |
| Immigrants | Oceania | 26.9 /100 | #193 | Fair 88.8% |
| Immigrants | Venezuela | 25.8 /100 | #194 | Fair 88.8% |
| Afghans | 23.9 /100 | #195 | Fair 88.8% |
| Immigrants | Southern Europe | 23.4 /100 | #196 | Fair 88.7% |
| French American Indians | 21.5 /100 | #197 | Fair 88.7% |