Peruvian vs Navajo Doctorate Degree
COMPARE
Peruvian
Navajo
Doctorate Degree
Doctorate Degree Comparison
Peruvians
Navajo
1.8%
DOCTORATE DEGREE
34.4/ 100
METRIC RATING
186th/ 347
METRIC RANK
1.4%
DOCTORATE DEGREE
0.1/ 100
METRIC RATING
316th/ 347
METRIC RANK
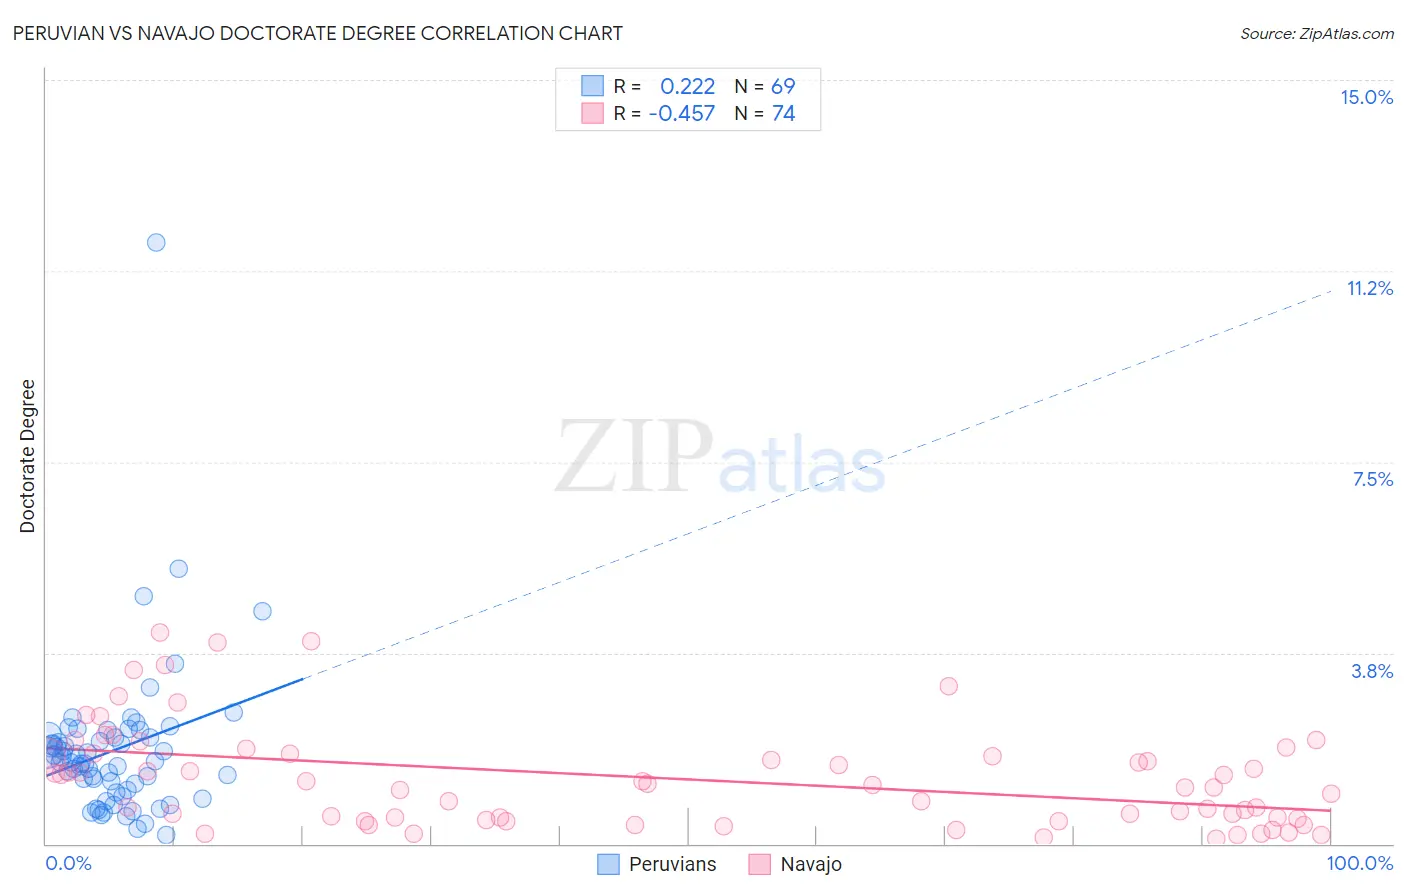
Peruvian vs Navajo Doctorate Degree Correlation Chart
The statistical analysis conducted on geographies consisting of 360,973,497 people shows a weak positive correlation between the proportion of Peruvians and percentage of population with at least doctorate degree education in the United States with a correlation coefficient (R) of 0.222 and weighted average of 1.8%. Similarly, the statistical analysis conducted on geographies consisting of 222,101,236 people shows a moderate negative correlation between the proportion of Navajo and percentage of population with at least doctorate degree education in the United States with a correlation coefficient (R) of -0.457 and weighted average of 1.4%, a difference of 32.9%.
Doctorate Degree Correlation Summary
| Measurement | Peruvian | Navajo |
| Minimum | 0.17% | 0.090% |
| Maximum | 11.8% | 4.2% |
| Range | 11.6% | 4.1% |
| Mean | 1.8% | 1.3% |
| Median | 1.6% | 1.1% |
| Interquartile 25% (IQ1) | 1.0% | 0.50% |
| Interquartile 75% (IQ3) | 2.1% | 1.8% |
| Interquartile Range (IQR) | 1.1% | 1.3% |
| Standard Deviation (Sample) | 1.6% | 1.0% |
| Standard Deviation (Population) | 1.5% | 1.00% |
Similar Demographics by Doctorate Degree
Demographics Similar to Peruvians by Doctorate Degree
In terms of doctorate degree, the demographic groups most similar to Peruvians are Czechoslovakian (1.8%, a difference of 0.23%), Slovak (1.8%, a difference of 0.32%), German (1.8%, a difference of 0.68%), French Canadian (1.8%, a difference of 0.72%), and Immigrants from Costa Rica (1.8%, a difference of 0.73%).
| Demographics | Rating | Rank | Doctorate Degree |
| Ghanaians | 48.3 /100 | #179 | Average 1.8% |
| Scandinavians | 48.0 /100 | #180 | Average 1.8% |
| Immigrants | Immigrants | 46.2 /100 | #181 | Average 1.8% |
| Immigrants | Afghanistan | 44.3 /100 | #182 | Average 1.8% |
| Finns | 42.1 /100 | #183 | Average 1.8% |
| Nigerians | 39.9 /100 | #184 | Fair 1.8% |
| Slovaks | 36.4 /100 | #185 | Fair 1.8% |
| Peruvians | 34.4 /100 | #186 | Fair 1.8% |
| Czechoslovakians | 33.0 /100 | #187 | Fair 1.8% |
| Germans | 30.5 /100 | #188 | Fair 1.8% |
| French Canadians | 30.2 /100 | #189 | Fair 1.8% |
| Immigrants | Costa Rica | 30.2 /100 | #190 | Fair 1.8% |
| South Americans | 29.5 /100 | #191 | Fair 1.8% |
| Dutch | 27.4 /100 | #192 | Fair 1.8% |
| German Russians | 27.1 /100 | #193 | Fair 1.8% |
Demographics Similar to Navajo by Doctorate Degree
In terms of doctorate degree, the demographic groups most similar to Navajo are Immigrants from the Azores (1.4%, a difference of 0.21%), Dominican (1.4%, a difference of 0.23%), Immigrants from Micronesia (1.3%, a difference of 0.25%), Creek (1.3%, a difference of 0.30%), and Menominee (1.4%, a difference of 0.31%).
| Demographics | Rating | Rank | Doctorate Degree |
| Immigrants | Grenada | 0.1 /100 | #309 | Tragic 1.4% |
| Immigrants | Jamaica | 0.1 /100 | #310 | Tragic 1.4% |
| Immigrants | Honduras | 0.1 /100 | #311 | Tragic 1.4% |
| Immigrants | Nicaragua | 0.1 /100 | #312 | Tragic 1.4% |
| Menominee | 0.1 /100 | #313 | Tragic 1.4% |
| Dominicans | 0.1 /100 | #314 | Tragic 1.4% |
| Immigrants | Azores | 0.1 /100 | #315 | Tragic 1.4% |
| Navajo | 0.1 /100 | #316 | Tragic 1.4% |
| Immigrants | Micronesia | 0.1 /100 | #317 | Tragic 1.3% |
| Creek | 0.1 /100 | #318 | Tragic 1.3% |
| Immigrants | Guyana | 0.1 /100 | #319 | Tragic 1.3% |
| Immigrants | St. Vincent and the Grenadines | 0.1 /100 | #320 | Tragic 1.3% |
| Dutch West Indians | 0.1 /100 | #321 | Tragic 1.3% |
| Seminole | 0.1 /100 | #322 | Tragic 1.3% |
| Immigrants | Belize | 0.1 /100 | #323 | Tragic 1.3% |