Peruvian vs Soviet Union 4th Grade
COMPARE
Peruvian
Soviet Union
4th Grade
4th Grade Comparison
Peruvians
Soviet Union
97.1%
4TH GRADE
0.7/ 100
METRIC RATING
255th/ 347
METRIC RANK
97.6%
4TH GRADE
77.8/ 100
METRIC RATING
149th/ 347
METRIC RANK
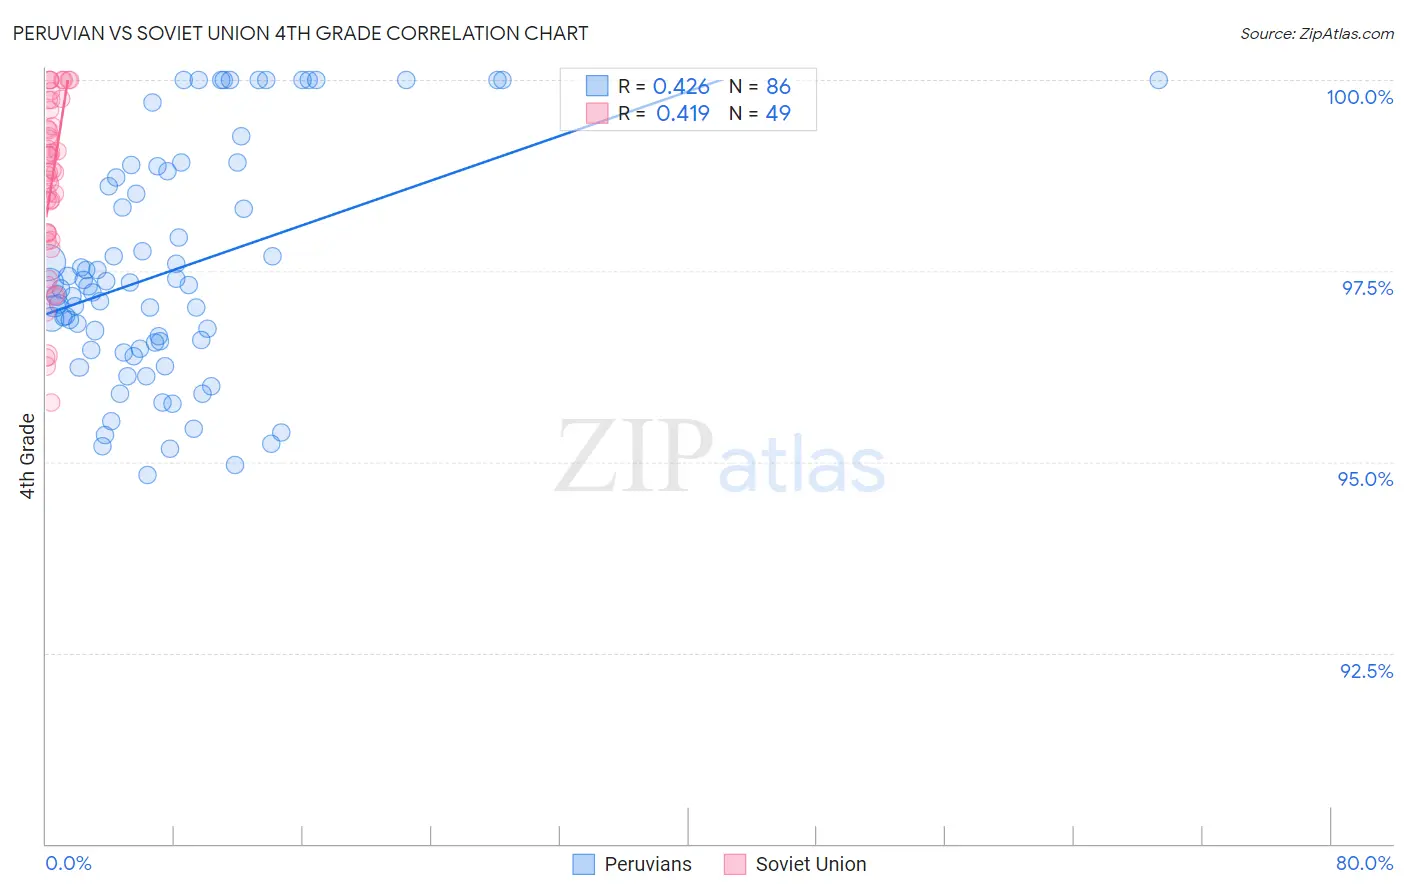
Peruvian vs Soviet Union 4th Grade Correlation Chart
The statistical analysis conducted on geographies consisting of 363,068,462 people shows a moderate positive correlation between the proportion of Peruvians and percentage of population with at least 4th grade education in the United States with a correlation coefficient (R) of 0.426 and weighted average of 97.1%. Similarly, the statistical analysis conducted on geographies consisting of 43,454,395 people shows a moderate positive correlation between the proportion of Soviet Union and percentage of population with at least 4th grade education in the United States with a correlation coefficient (R) of 0.419 and weighted average of 97.6%, a difference of 0.59%.
4th Grade Correlation Summary
| Measurement | Peruvian | Soviet Union |
| Minimum | 94.8% | 95.8% |
| Maximum | 100.0% | 100.0% |
| Range | 5.2% | 4.2% |
| Mean | 97.5% | 98.6% |
| Median | 97.3% | 98.8% |
| Interquartile 25% (IQ1) | 96.5% | 97.9% |
| Interquartile 75% (IQ3) | 98.7% | 99.5% |
| Interquartile Range (IQR) | 2.2% | 1.6% |
| Standard Deviation (Sample) | 1.5% | 1.1% |
| Standard Deviation (Population) | 1.5% | 1.1% |
Similar Demographics by 4th Grade
Demographics Similar to Peruvians by 4th Grade
In terms of 4th grade, the demographic groups most similar to Peruvians are Bolivian (97.1%, a difference of 0.0%), Immigrants from Liberia (97.1%, a difference of 0.010%), Immigrants from Middle Africa (97.1%, a difference of 0.010%), Immigrants from Senegal (97.1%, a difference of 0.020%), and South American (97.1%, a difference of 0.020%).
| Demographics | Rating | Rank | 4th Grade |
| Immigrants | Asia | 1.2 /100 | #248 | Tragic 97.1% |
| Immigrants | Africa | 1.0 /100 | #249 | Tragic 97.1% |
| Immigrants | Senegal | 0.9 /100 | #250 | Tragic 97.1% |
| South Americans | 0.8 /100 | #251 | Tragic 97.1% |
| Jamaicans | 0.8 /100 | #252 | Tragic 97.1% |
| Immigrants | Liberia | 0.8 /100 | #253 | Tragic 97.1% |
| Immigrants | Middle Africa | 0.8 /100 | #254 | Tragic 97.1% |
| Peruvians | 0.7 /100 | #255 | Tragic 97.1% |
| Bolivians | 0.7 /100 | #256 | Tragic 97.1% |
| Immigrants | Congo | 0.5 /100 | #257 | Tragic 97.0% |
| Immigrants | Colombia | 0.5 /100 | #258 | Tragic 97.0% |
| Immigrants | Ethiopia | 0.4 /100 | #259 | Tragic 97.0% |
| Immigrants | Sierra Leone | 0.4 /100 | #260 | Tragic 97.0% |
| Immigrants | South America | 0.4 /100 | #261 | Tragic 97.0% |
| West Indians | 0.4 /100 | #262 | Tragic 97.0% |
Demographics Similar to Soviet Union by 4th Grade
In terms of 4th grade, the demographic groups most similar to Soviet Union are Immigrants from Israel (97.6%, a difference of 0.0%), Alsatian (97.6%, a difference of 0.0%), Immigrants from South Central Asia (97.6%, a difference of 0.010%), Jordanian (97.7%, a difference of 0.020%), and Ute (97.7%, a difference of 0.020%).
| Demographics | Rating | Rank | 4th Grade |
| Immigrants | North Macedonia | 83.3 /100 | #142 | Excellent 97.7% |
| Burmese | 82.8 /100 | #143 | Excellent 97.7% |
| Spaniards | 82.7 /100 | #144 | Excellent 97.7% |
| Immigrants | Moldova | 82.4 /100 | #145 | Excellent 97.7% |
| Jordanians | 81.3 /100 | #146 | Excellent 97.7% |
| Ute | 80.6 /100 | #147 | Excellent 97.7% |
| Hopi | 80.6 /100 | #148 | Excellent 97.7% |
| Soviet Union | 77.8 /100 | #149 | Good 97.6% |
| Immigrants | Israel | 77.7 /100 | #150 | Good 97.6% |
| Alsatians | 77.2 /100 | #151 | Good 97.6% |
| Immigrants | South Central Asia | 76.2 /100 | #152 | Good 97.6% |
| Immigrants | Eastern Europe | 71.3 /100 | #153 | Good 97.6% |
| Immigrants | Russia | 67.0 /100 | #154 | Good 97.6% |
| Albanians | 67.0 /100 | #155 | Good 97.6% |
| Immigrants | Jordan | 66.9 /100 | #156 | Good 97.6% |