Peruvian vs Soviet Union Unemployment
COMPARE
Peruvian
Soviet Union
Unemployment
Unemployment Comparison
Peruvians
Soviet Union
5.3%
UNEMPLOYMENT
29.9/ 100
METRIC RATING
196th/ 347
METRIC RANK
5.4%
UNEMPLOYMENT
10.6/ 100
METRIC RATING
220th/ 347
METRIC RANK
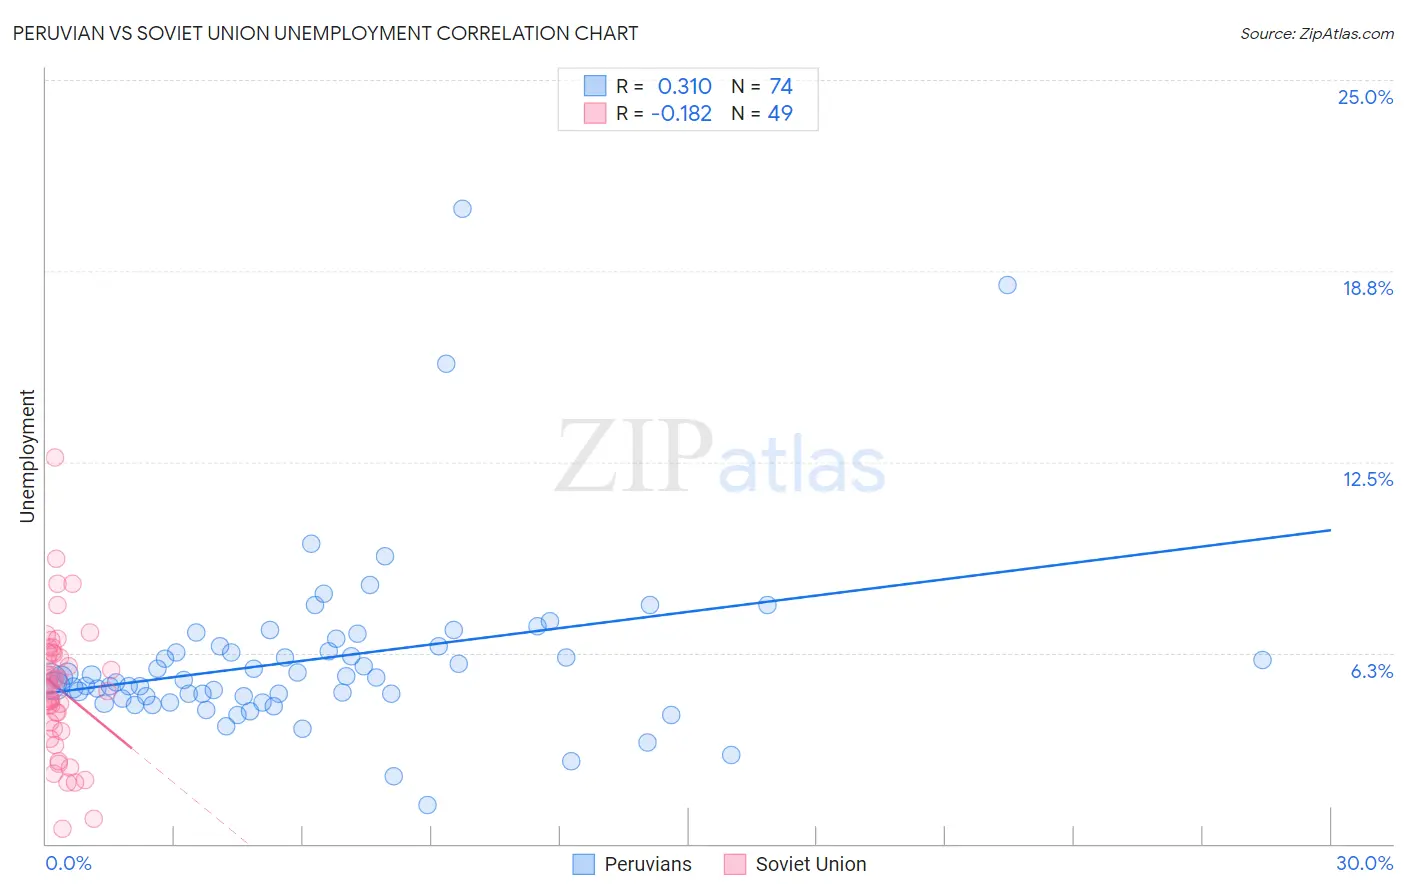
Peruvian vs Soviet Union Unemployment Correlation Chart
The statistical analysis conducted on geographies consisting of 362,987,684 people shows a mild positive correlation between the proportion of Peruvians and unemployment in the United States with a correlation coefficient (R) of 0.310 and weighted average of 5.3%. Similarly, the statistical analysis conducted on geographies consisting of 43,502,228 people shows a poor negative correlation between the proportion of Soviet Union and unemployment in the United States with a correlation coefficient (R) of -0.182 and weighted average of 5.4%, a difference of 1.9%.
Unemployment Correlation Summary
| Measurement | Peruvian | Soviet Union |
| Minimum | 1.3% | 0.50% |
| Maximum | 20.8% | 12.6% |
| Range | 19.5% | 12.1% |
| Mean | 6.0% | 5.1% |
| Median | 5.4% | 5.2% |
| Interquartile 25% (IQ1) | 4.8% | 3.7% |
| Interquartile 75% (IQ3) | 6.5% | 6.2% |
| Interquartile Range (IQR) | 1.6% | 2.5% |
| Standard Deviation (Sample) | 3.0% | 2.2% |
| Standard Deviation (Population) | 2.9% | 2.2% |
Similar Demographics by Unemployment
Demographics Similar to Peruvians by Unemployment
In terms of unemployment, the demographic groups most similar to Peruvians are Immigrants from Uruguay (5.3%, a difference of 0.010%), Immigrants from Southern Europe (5.3%, a difference of 0.070%), Immigrants from Laos (5.3%, a difference of 0.080%), Immigrants from Israel (5.3%, a difference of 0.090%), and Immigrants from Afghanistan (5.3%, a difference of 0.10%).
| Demographics | Rating | Rank | Unemployment |
| Immigrants | Belarus | 35.6 /100 | #189 | Fair 5.3% |
| Arabs | 35.3 /100 | #190 | Fair 5.3% |
| Somalis | 34.0 /100 | #191 | Fair 5.3% |
| South Americans | 33.9 /100 | #192 | Fair 5.3% |
| Immigrants | Somalia | 33.8 /100 | #193 | Fair 5.3% |
| Immigrants | Laos | 30.9 /100 | #194 | Fair 5.3% |
| Immigrants | Southern Europe | 30.9 /100 | #195 | Fair 5.3% |
| Peruvians | 29.9 /100 | #196 | Fair 5.3% |
| Immigrants | Uruguay | 29.8 /100 | #197 | Fair 5.3% |
| Immigrants | Israel | 28.6 /100 | #198 | Fair 5.3% |
| Immigrants | Afghanistan | 28.6 /100 | #199 | Fair 5.3% |
| Koreans | 27.4 /100 | #200 | Fair 5.3% |
| Immigrants | South Eastern Asia | 27.0 /100 | #201 | Fair 5.3% |
| Cherokee | 25.5 /100 | #202 | Fair 5.3% |
| Immigrants | Micronesia | 25.2 /100 | #203 | Fair 5.3% |
Demographics Similar to Soviet Union by Unemployment
In terms of unemployment, the demographic groups most similar to Soviet Union are Immigrants from Philippines (5.4%, a difference of 0.040%), Iroquois (5.4%, a difference of 0.060%), Bangladeshi (5.4%, a difference of 0.080%), Seminole (5.4%, a difference of 0.25%), and Choctaw (5.4%, a difference of 0.30%).
| Demographics | Rating | Rank | Unemployment |
| Immigrants | Middle Africa | 15.3 /100 | #213 | Poor 5.4% |
| Immigrants | Costa Rica | 15.2 /100 | #214 | Poor 5.4% |
| Delaware | 14.7 /100 | #215 | Poor 5.4% |
| Immigrants | South America | 13.5 /100 | #216 | Poor 5.4% |
| Immigrants | Albania | 13.5 /100 | #217 | Poor 5.4% |
| Choctaw | 12.7 /100 | #218 | Poor 5.4% |
| Bangladeshis | 11.2 /100 | #219 | Poor 5.4% |
| Soviet Union | 10.6 /100 | #220 | Poor 5.4% |
| Immigrants | Philippines | 10.4 /100 | #221 | Poor 5.4% |
| Iroquois | 10.3 /100 | #222 | Poor 5.4% |
| Seminole | 9.2 /100 | #223 | Tragic 5.4% |
| Israelis | 8.8 /100 | #224 | Tragic 5.4% |
| South American Indians | 7.8 /100 | #225 | Tragic 5.5% |
| Samoans | 7.1 /100 | #226 | Tragic 5.5% |
| Immigrants | Lebanon | 7.0 /100 | #227 | Tragic 5.5% |