Peruvian vs Immigrants from Chile Professional Degree
COMPARE
Peruvian
Immigrants from Chile
Professional Degree
Professional Degree Comparison
Peruvians
Immigrants from Chile
4.5%
PROFESSIONAL DEGREE
65.2/ 100
METRIC RATING
162nd/ 347
METRIC RANK
5.3%
PROFESSIONAL DEGREE
99.5/ 100
METRIC RATING
87th/ 347
METRIC RANK
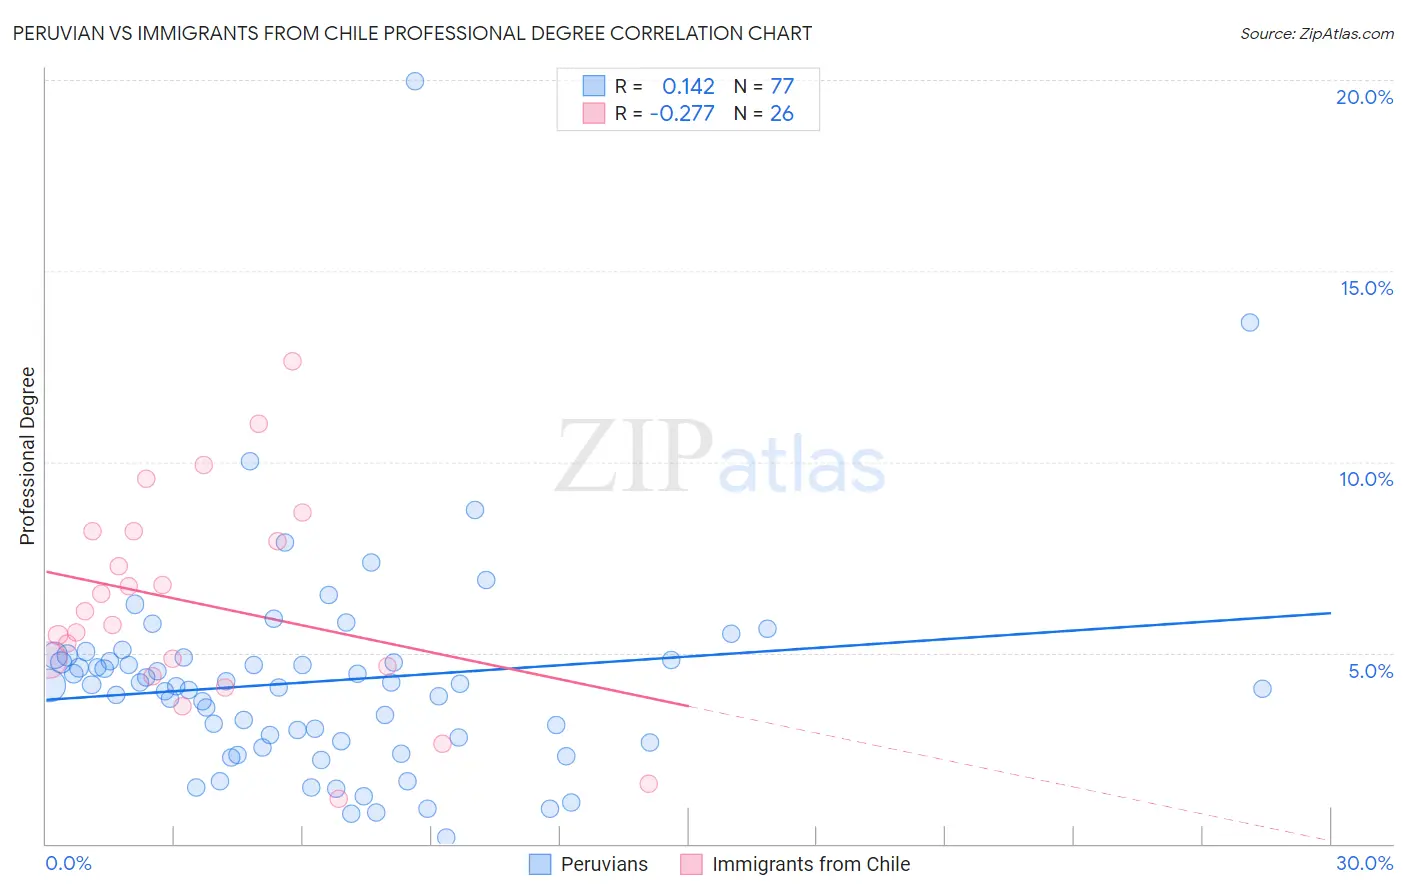
Peruvian vs Immigrants from Chile Professional Degree Correlation Chart
The statistical analysis conducted on geographies consisting of 362,706,840 people shows a poor positive correlation between the proportion of Peruvians and percentage of population with at least professional degree education in the United States with a correlation coefficient (R) of 0.142 and weighted average of 4.5%. Similarly, the statistical analysis conducted on geographies consisting of 218,541,106 people shows a weak negative correlation between the proportion of Immigrants from Chile and percentage of population with at least professional degree education in the United States with a correlation coefficient (R) of -0.277 and weighted average of 5.3%, a difference of 16.8%.
Professional Degree Correlation Summary
| Measurement | Peruvian | Immigrants from Chile |
| Minimum | 0.17% | 1.2% |
| Maximum | 20.0% | 12.6% |
| Range | 19.8% | 11.5% |
| Mean | 4.2% | 6.3% |
| Median | 4.1% | 5.9% |
| Interquartile 25% (IQ1) | 2.7% | 4.7% |
| Interquartile 75% (IQ3) | 4.8% | 8.2% |
| Interquartile Range (IQR) | 2.2% | 3.5% |
| Standard Deviation (Sample) | 2.8% | 2.8% |
| Standard Deviation (Population) | 2.8% | 2.7% |
Similar Demographics by Professional Degree
Demographics Similar to Peruvians by Professional Degree
In terms of professional degree, the demographic groups most similar to Peruvians are Sierra Leonean (4.5%, a difference of 0.14%), Assyrian/Chaldean/Syriac (4.5%, a difference of 0.34%), Immigrants from Senegal (4.5%, a difference of 0.44%), Vietnamese (4.5%, a difference of 0.50%), and Immigrants from Armenia (4.5%, a difference of 0.58%).
| Demographics | Rating | Rank | Professional Degree |
| Slavs | 70.8 /100 | #155 | Good 4.5% |
| Swedes | 69.9 /100 | #156 | Good 4.5% |
| Iraqis | 69.8 /100 | #157 | Good 4.5% |
| Immigrants | Armenia | 68.8 /100 | #158 | Good 4.5% |
| Vietnamese | 68.4 /100 | #159 | Good 4.5% |
| Immigrants | Senegal | 68.0 /100 | #160 | Good 4.5% |
| Assyrians/Chaldeans/Syriacs | 67.4 /100 | #161 | Good 4.5% |
| Peruvians | 65.2 /100 | #162 | Good 4.5% |
| Sierra Leoneans | 64.3 /100 | #163 | Good 4.5% |
| Swiss | 61.0 /100 | #164 | Good 4.5% |
| Costa Ricans | 59.9 /100 | #165 | Average 4.5% |
| Immigrants | Colombia | 59.4 /100 | #166 | Average 4.5% |
| Immigrants | Afghanistan | 59.2 /100 | #167 | Average 4.5% |
| Immigrants | Sierra Leone | 58.7 /100 | #168 | Average 4.5% |
| Chinese | 58.6 /100 | #169 | Average 4.5% |
Demographics Similar to Immigrants from Chile by Professional Degree
In terms of professional degree, the demographic groups most similar to Immigrants from Chile are Immigrants from Zimbabwe (5.3%, a difference of 0.11%), Greek (5.3%, a difference of 0.11%), Carpatho Rusyn (5.3%, a difference of 0.13%), Immigrants from Croatia (5.3%, a difference of 0.13%), and Egyptian (5.3%, a difference of 0.14%).
| Demographics | Rating | Rank | Professional Degree |
| Immigrants | England | 99.6 /100 | #80 | Exceptional 5.3% |
| Immigrants | Brazil | 99.6 /100 | #81 | Exceptional 5.3% |
| Romanians | 99.6 /100 | #82 | Exceptional 5.3% |
| Carpatho Rusyns | 99.6 /100 | #83 | Exceptional 5.3% |
| Immigrants | Croatia | 99.6 /100 | #84 | Exceptional 5.3% |
| Immigrants | Zimbabwe | 99.6 /100 | #85 | Exceptional 5.3% |
| Greeks | 99.6 /100 | #86 | Exceptional 5.3% |
| Immigrants | Chile | 99.5 /100 | #87 | Exceptional 5.3% |
| Egyptians | 99.5 /100 | #88 | Exceptional 5.3% |
| Chileans | 99.5 /100 | #89 | Exceptional 5.3% |
| Immigrants | Scotland | 99.5 /100 | #90 | Exceptional 5.3% |
| Laotians | 99.5 /100 | #91 | Exceptional 5.2% |
| Immigrants | Eastern Europe | 99.5 /100 | #92 | Exceptional 5.2% |
| Northern Europeans | 99.3 /100 | #93 | Exceptional 5.2% |
| Alsatians | 99.3 /100 | #94 | Exceptional 5.2% |