Peruvian vs Immigrants from Chile Disability Age 18 to 34
COMPARE
Peruvian
Immigrants from Chile
Disability Age 18 to 34
Disability Age 18 to 34 Comparison
Peruvians
Immigrants from Chile
6.0%
DISABILITY AGE 18 TO 34
99.6/ 100
METRIC RATING
62nd/ 347
METRIC RANK
6.1%
DISABILITY AGE 18 TO 34
98.5/ 100
METRIC RATING
80th/ 347
METRIC RANK
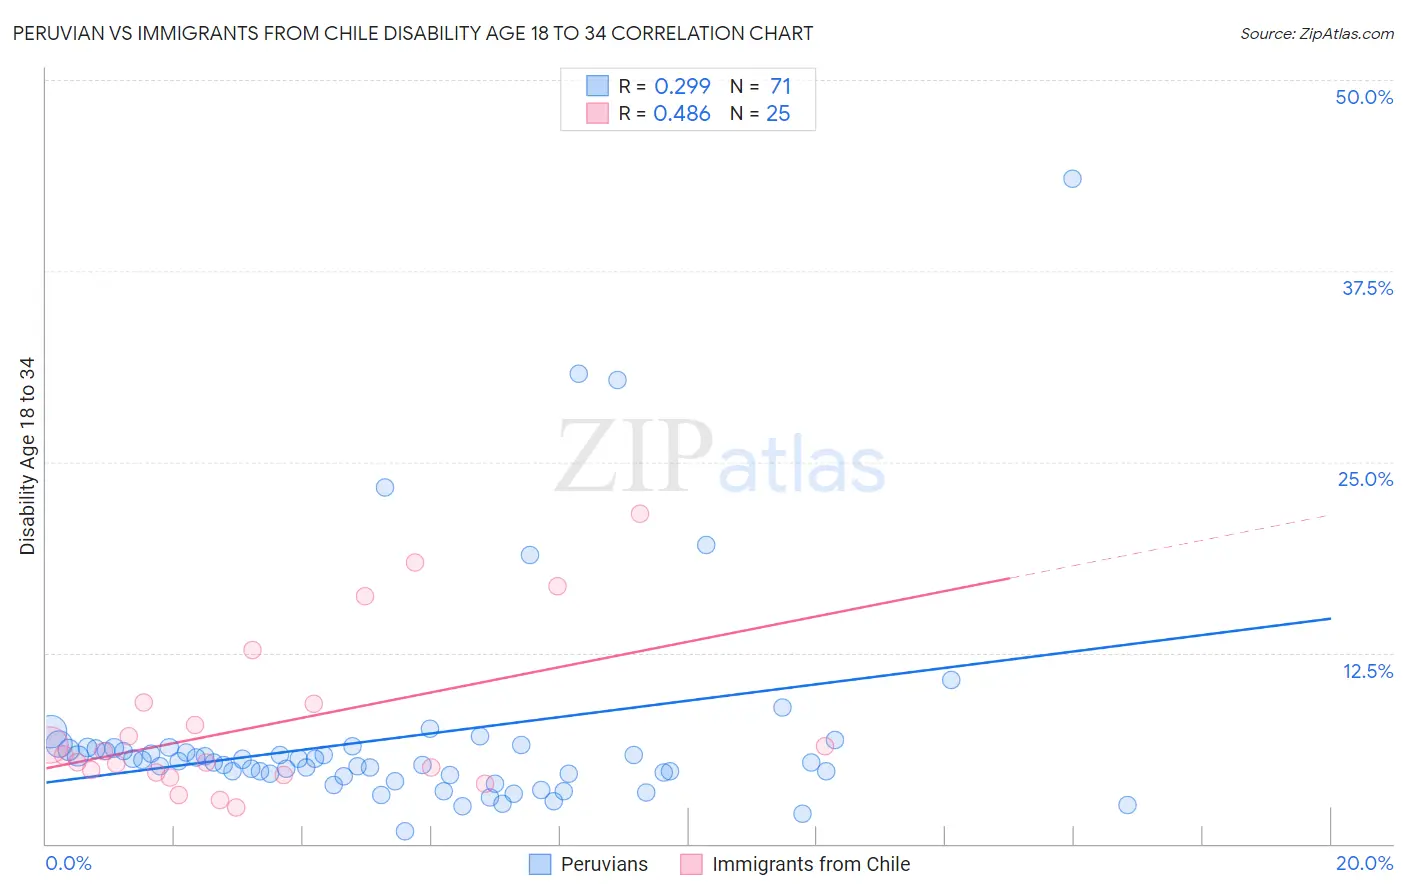
Peruvian vs Immigrants from Chile Disability Age 18 to 34 Correlation Chart
The statistical analysis conducted on geographies consisting of 362,638,552 people shows a weak positive correlation between the proportion of Peruvians and percentage of population with a disability between the ages 18 and 35 in the United States with a correlation coefficient (R) of 0.299 and weighted average of 6.0%. Similarly, the statistical analysis conducted on geographies consisting of 218,467,442 people shows a moderate positive correlation between the proportion of Immigrants from Chile and percentage of population with a disability between the ages 18 and 35 in the United States with a correlation coefficient (R) of 0.486 and weighted average of 6.1%, a difference of 2.4%.
Disability Age 18 to 34 Correlation Summary
| Measurement | Peruvian | Immigrants from Chile |
| Minimum | 0.85% | 2.3% |
| Maximum | 43.5% | 21.6% |
| Range | 42.7% | 19.3% |
| Mean | 7.0% | 7.8% |
| Median | 5.4% | 5.8% |
| Interquartile 25% (IQ1) | 4.5% | 4.6% |
| Interquartile 75% (IQ3) | 6.3% | 9.2% |
| Interquartile Range (IQR) | 1.8% | 4.6% |
| Standard Deviation (Sample) | 7.0% | 5.2% |
| Standard Deviation (Population) | 6.9% | 5.1% |
Demographics Similar to Peruvians and Immigrants from Chile by Disability Age 18 to 34
In terms of disability age 18 to 34, the demographic groups most similar to Peruvians are British West Indian (6.0%, a difference of 0.030%), Salvadoran (6.0%, a difference of 0.050%), Taiwanese (6.0%, a difference of 0.070%), Trinidadian and Tobagonian (6.0%, a difference of 0.21%), and Burmese (6.0%, a difference of 0.35%). Similarly, the demographic groups most similar to Immigrants from Chile are Immigrants from Australia (6.1%, a difference of 0.040%), Afghan (6.1%, a difference of 0.19%), Immigrants from Russia (6.1%, a difference of 0.49%), Assyrian/Chaldean/Syriac (6.1%, a difference of 0.49%), and Immigrants from Western Asia (6.1%, a difference of 0.59%).
| Demographics | Rating | Rank | Disability Age 18 to 34 |
| British West Indians | 99.6 /100 | #61 | Exceptional 6.0% |
| Peruvians | 99.6 /100 | #62 | Exceptional 6.0% |
| Salvadorans | 99.6 /100 | #63 | Exceptional 6.0% |
| Taiwanese | 99.6 /100 | #64 | Exceptional 6.0% |
| Trinidadians and Tobagonians | 99.5 /100 | #65 | Exceptional 6.0% |
| Burmese | 99.5 /100 | #66 | Exceptional 6.0% |
| Immigrants | North Macedonia | 99.5 /100 | #67 | Exceptional 6.0% |
| Immigrants | Poland | 99.5 /100 | #68 | Exceptional 6.0% |
| Immigrants | West Indies | 99.4 /100 | #69 | Exceptional 6.0% |
| Immigrants | Greece | 99.4 /100 | #70 | Exceptional 6.0% |
| Immigrants | Japan | 99.3 /100 | #71 | Exceptional 6.0% |
| Immigrants | Lebanon | 99.2 /100 | #72 | Exceptional 6.0% |
| Cypriots | 99.2 /100 | #73 | Exceptional 6.0% |
| Haitians | 99.2 /100 | #74 | Exceptional 6.0% |
| Immigrants | Turkey | 99.1 /100 | #75 | Exceptional 6.1% |
| Immigrants | Western Asia | 98.9 /100 | #76 | Exceptional 6.1% |
| Immigrants | Russia | 98.9 /100 | #77 | Exceptional 6.1% |
| Assyrians/Chaldeans/Syriacs | 98.9 /100 | #78 | Exceptional 6.1% |
| Afghans | 98.7 /100 | #79 | Exceptional 6.1% |
| Immigrants | Chile | 98.5 /100 | #80 | Exceptional 6.1% |
| Immigrants | Australia | 98.5 /100 | #81 | Exceptional 6.1% |