Arab vs Immigrants from Chile No Schooling Completed
COMPARE
Arab
Immigrants from Chile
No Schooling Completed
No Schooling Completed Comparison
Arabs
Immigrants from Chile
2.1%
NO SCHOOLING COMPLETED
46.4/ 100
METRIC RATING
175th/ 347
METRIC RANK
2.2%
NO SCHOOLING COMPLETED
22.7/ 100
METRIC RATING
198th/ 347
METRIC RANK
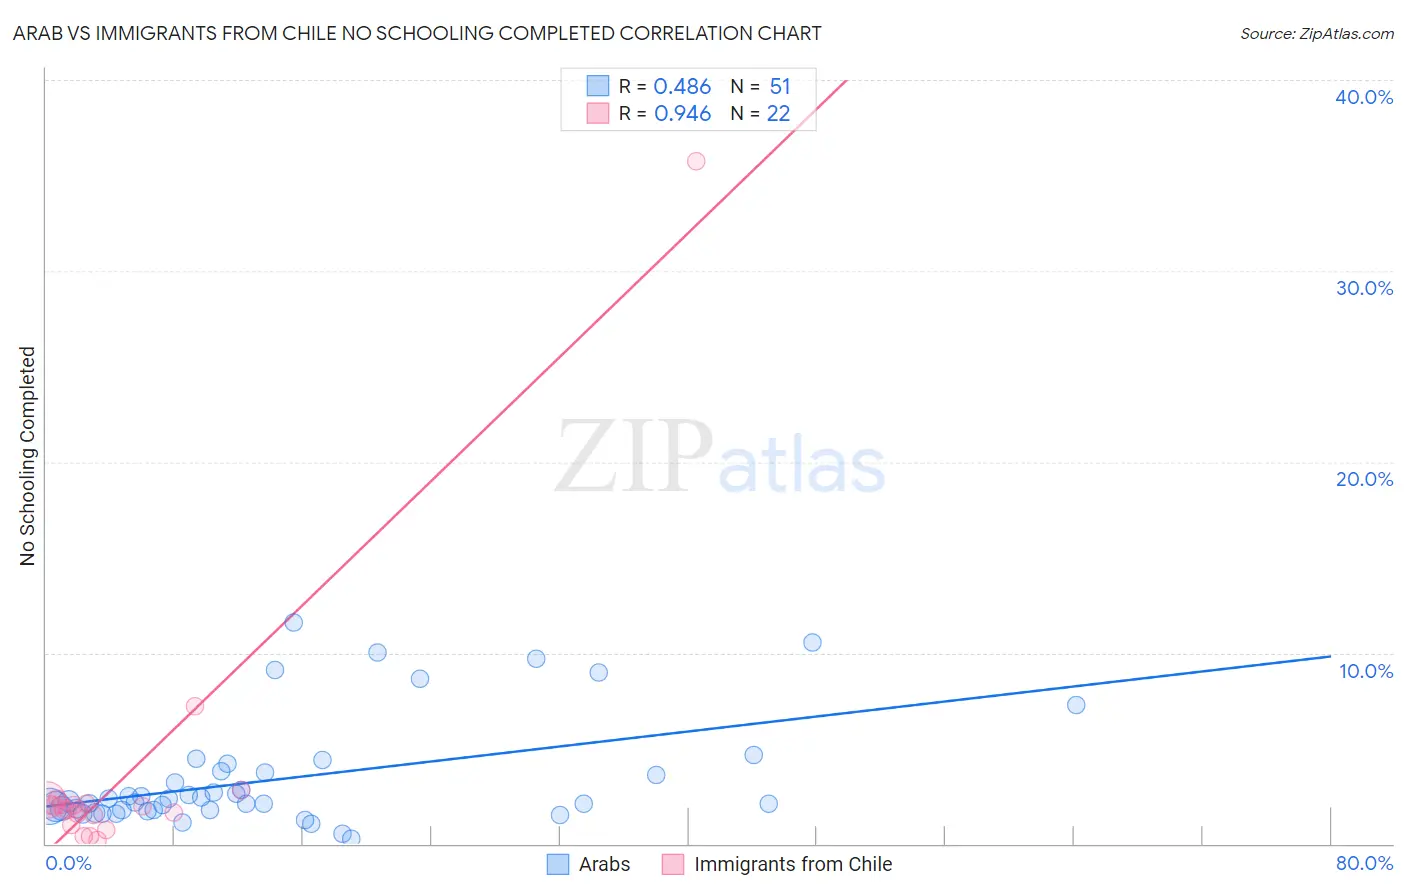
Arab vs Immigrants from Chile No Schooling Completed Correlation Chart
The statistical analysis conducted on geographies consisting of 479,384,082 people shows a moderate positive correlation between the proportion of Arabs and percentage of population with no schooling in the United States with a correlation coefficient (R) of 0.486 and weighted average of 2.1%. Similarly, the statistical analysis conducted on geographies consisting of 217,752,126 people shows a near-perfect positive correlation between the proportion of Immigrants from Chile and percentage of population with no schooling in the United States with a correlation coefficient (R) of 0.946 and weighted average of 2.2%, a difference of 3.6%.
No Schooling Completed Correlation Summary
| Measurement | Arab | Immigrants from Chile |
| Minimum | 0.23% | 0.21% |
| Maximum | 11.6% | 35.7% |
| Range | 11.3% | 35.5% |
| Mean | 3.4% | 3.4% |
| Median | 2.2% | 1.9% |
| Interquartile 25% (IQ1) | 1.8% | 1.5% |
| Interquartile 75% (IQ3) | 3.8% | 2.1% |
| Interquartile Range (IQR) | 2.0% | 0.53% |
| Standard Deviation (Sample) | 2.8% | 7.3% |
| Standard Deviation (Population) | 2.8% | 7.2% |
Similar Demographics by No Schooling Completed
Demographics Similar to Arabs by No Schooling Completed
In terms of no schooling completed, the demographic groups most similar to Arabs are Panamanian (2.1%, a difference of 0.17%), Arapaho (2.1%, a difference of 0.19%), Pakistani (2.1%, a difference of 0.23%), Immigrants from Kazakhstan (2.1%, a difference of 0.29%), and Portuguese (2.1%, a difference of 0.35%).
| Demographics | Rating | Rank | No Schooling Completed |
| Cheyenne | 58.6 /100 | #168 | Average 2.1% |
| Apache | 56.7 /100 | #169 | Average 2.1% |
| Argentineans | 56.0 /100 | #170 | Average 2.1% |
| Immigrants | Poland | 55.2 /100 | #171 | Average 2.1% |
| Immigrants | Argentina | 52.7 /100 | #172 | Average 2.1% |
| Immigrants | Belarus | 51.8 /100 | #173 | Average 2.1% |
| Immigrants | Micronesia | 50.0 /100 | #174 | Average 2.1% |
| Arabs | 46.4 /100 | #175 | Average 2.1% |
| Panamanians | 45.2 /100 | #176 | Average 2.1% |
| Arapaho | 45.0 /100 | #177 | Average 2.1% |
| Pakistanis | 44.7 /100 | #178 | Average 2.1% |
| Immigrants | Kazakhstan | 44.3 /100 | #179 | Average 2.1% |
| Portuguese | 43.9 /100 | #180 | Average 2.1% |
| Immigrants | Taiwan | 42.6 /100 | #181 | Average 2.1% |
| French American Indians | 42.2 /100 | #182 | Average 2.1% |
Demographics Similar to Immigrants from Chile by No Schooling Completed
In terms of no schooling completed, the demographic groups most similar to Immigrants from Chile are African (2.2%, a difference of 0.17%), Immigrants from Southern Europe (2.2%, a difference of 0.18%), Immigrants from Ukraine (2.2%, a difference of 0.60%), Immigrants from Northern Africa (2.2%, a difference of 0.64%), and Hawaiian (2.2%, a difference of 0.75%).
| Demographics | Rating | Rank | No Schooling Completed |
| Bermudans | 30.7 /100 | #191 | Fair 2.1% |
| Guamanians/Chamorros | 29.8 /100 | #192 | Fair 2.2% |
| Paraguayans | 29.3 /100 | #193 | Fair 2.2% |
| Immigrants | Albania | 28.3 /100 | #194 | Fair 2.2% |
| Hawaiians | 27.0 /100 | #195 | Fair 2.2% |
| Immigrants | Ukraine | 26.1 /100 | #196 | Fair 2.2% |
| Immigrants | Southern Europe | 23.8 /100 | #197 | Fair 2.2% |
| Immigrants | Chile | 22.7 /100 | #198 | Fair 2.2% |
| Africans | 21.8 /100 | #199 | Fair 2.2% |
| Immigrants | Northern Africa | 19.5 /100 | #200 | Poor 2.2% |
| Costa Ricans | 17.1 /100 | #201 | Poor 2.2% |
| Moroccans | 13.7 /100 | #202 | Poor 2.2% |
| Laotians | 13.3 /100 | #203 | Poor 2.2% |
| Hopi | 12.9 /100 | #204 | Poor 2.2% |
| Immigrants | Bahamas | 11.6 /100 | #205 | Poor 2.2% |