Paraguayan vs Carpatho Rusyn Bachelor's Degree
COMPARE
Paraguayan
Carpatho Rusyn
Bachelor's Degree
Bachelor's Degree Comparison
Paraguayans
Carpatho Rusyns
44.0%
BACHELOR'S DEGREE
99.9/ 100
METRIC RATING
57th/ 347
METRIC RANK
42.1%
BACHELOR'S DEGREE
99.0/ 100
METRIC RATING
87th/ 347
METRIC RANK
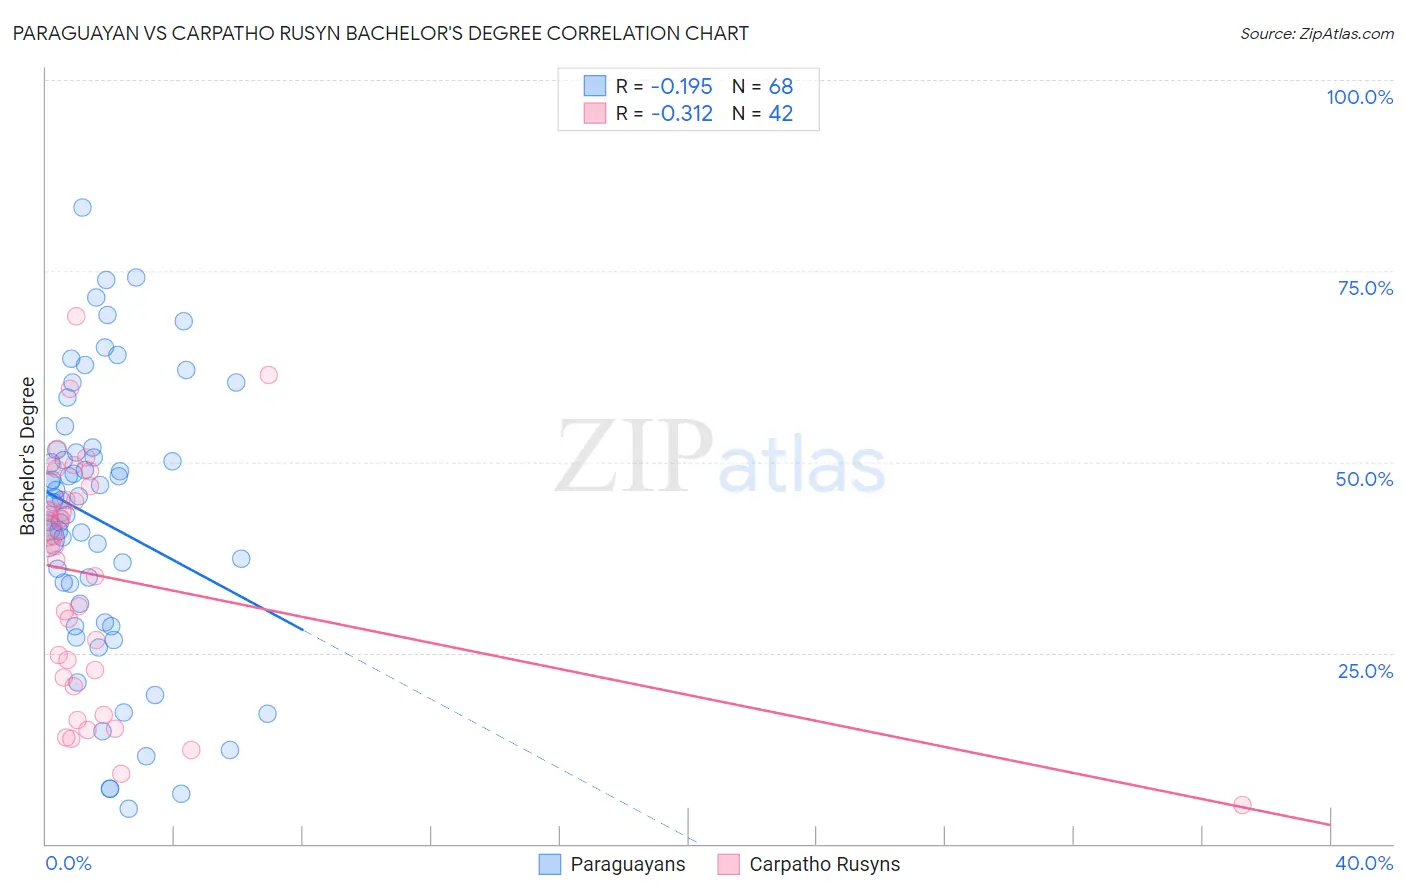
Paraguayan vs Carpatho Rusyn Bachelor's Degree Correlation Chart
The statistical analysis conducted on geographies consisting of 95,113,072 people shows a poor negative correlation between the proportion of Paraguayans and percentage of population with at least bachelor's degree education in the United States with a correlation coefficient (R) of -0.195 and weighted average of 44.0%. Similarly, the statistical analysis conducted on geographies consisting of 58,871,690 people shows a mild negative correlation between the proportion of Carpatho Rusyns and percentage of population with at least bachelor's degree education in the United States with a correlation coefficient (R) of -0.312 and weighted average of 42.1%, a difference of 4.6%.
Bachelor's Degree Correlation Summary
| Measurement | Paraguayan | Carpatho Rusyn |
| Minimum | 4.5% | 5.1% |
| Maximum | 83.2% | 69.0% |
| Range | 78.7% | 63.9% |
| Mean | 42.3% | 34.9% |
| Median | 44.9% | 39.1% |
| Interquartile 25% (IQ1) | 30.2% | 21.8% |
| Interquartile 75% (IQ3) | 51.4% | 45.0% |
| Interquartile Range (IQR) | 21.2% | 23.2% |
| Standard Deviation (Sample) | 18.1% | 15.6% |
| Standard Deviation (Population) | 17.9% | 15.4% |
Similar Demographics by Bachelor's Degree
Demographics Similar to Paraguayans by Bachelor's Degree
In terms of bachelor's degree, the demographic groups most similar to Paraguayans are Immigrants from Czechoslovakia (44.0%, a difference of 0.050%), Australian (44.0%, a difference of 0.16%), New Zealander (44.0%, a difference of 0.16%), Immigrants from Serbia (44.1%, a difference of 0.19%), and Immigrants from Austria (44.2%, a difference of 0.37%).
| Demographics | Rating | Rank | Bachelor's Degree |
| Immigrants | Greece | 99.9 /100 | #50 | Exceptional 44.5% |
| Asians | 99.9 /100 | #51 | Exceptional 44.4% |
| Immigrants | Spain | 99.9 /100 | #52 | Exceptional 44.3% |
| Immigrants | Asia | 99.9 /100 | #53 | Exceptional 44.3% |
| Immigrants | Austria | 99.9 /100 | #54 | Exceptional 44.2% |
| Immigrants | Bolivia | 99.9 /100 | #55 | Exceptional 44.2% |
| Immigrants | Serbia | 99.9 /100 | #56 | Exceptional 44.1% |
| Paraguayans | 99.9 /100 | #57 | Exceptional 44.0% |
| Immigrants | Czechoslovakia | 99.9 /100 | #58 | Exceptional 44.0% |
| Australians | 99.9 /100 | #59 | Exceptional 44.0% |
| New Zealanders | 99.9 /100 | #60 | Exceptional 44.0% |
| South Africans | 99.8 /100 | #61 | Exceptional 43.6% |
| Immigrants | Kazakhstan | 99.8 /100 | #62 | Exceptional 43.4% |
| Immigrants | Europe | 99.8 /100 | #63 | Exceptional 43.4% |
| Argentineans | 99.7 /100 | #64 | Exceptional 43.3% |
Demographics Similar to Carpatho Rusyns by Bachelor's Degree
In terms of bachelor's degree, the demographic groups most similar to Carpatho Rusyns are Immigrants from Western Europe (42.0%, a difference of 0.12%), Greek (42.0%, a difference of 0.12%), Laotian (42.0%, a difference of 0.25%), Immigrants from Brazil (42.2%, a difference of 0.30%), and Immigrants from Northern Africa (41.9%, a difference of 0.35%).
| Demographics | Rating | Rank | Bachelor's Degree |
| Immigrants | Croatia | 99.2 /100 | #80 | Exceptional 42.3% |
| Immigrants | Hungary | 99.2 /100 | #81 | Exceptional 42.3% |
| Immigrants | Scotland | 99.2 /100 | #82 | Exceptional 42.3% |
| Armenians | 99.2 /100 | #83 | Exceptional 42.3% |
| Immigrants | Western Asia | 99.2 /100 | #84 | Exceptional 42.3% |
| Lithuanians | 99.2 /100 | #85 | Exceptional 42.2% |
| Immigrants | Brazil | 99.2 /100 | #86 | Exceptional 42.2% |
| Carpatho Rusyns | 99.0 /100 | #87 | Exceptional 42.1% |
| Immigrants | Western Europe | 99.0 /100 | #88 | Exceptional 42.0% |
| Greeks | 99.0 /100 | #89 | Exceptional 42.0% |
| Laotians | 98.9 /100 | #90 | Exceptional 42.0% |
| Immigrants | Northern Africa | 98.9 /100 | #91 | Exceptional 41.9% |
| Maltese | 98.8 /100 | #92 | Exceptional 41.9% |
| Immigrants | Canada | 98.6 /100 | #93 | Exceptional 41.7% |
| Immigrants | Nepal | 98.6 /100 | #94 | Exceptional 41.7% |