Paraguayan vs Israeli Bachelor's Degree
COMPARE
Paraguayan
Israeli
Bachelor's Degree
Bachelor's Degree Comparison
Paraguayans
Israelis
44.0%
BACHELOR'S DEGREE
99.9/ 100
METRIC RATING
57th/ 347
METRIC RANK
46.1%
BACHELOR'S DEGREE
100.0/ 100
METRIC RATING
29th/ 347
METRIC RANK
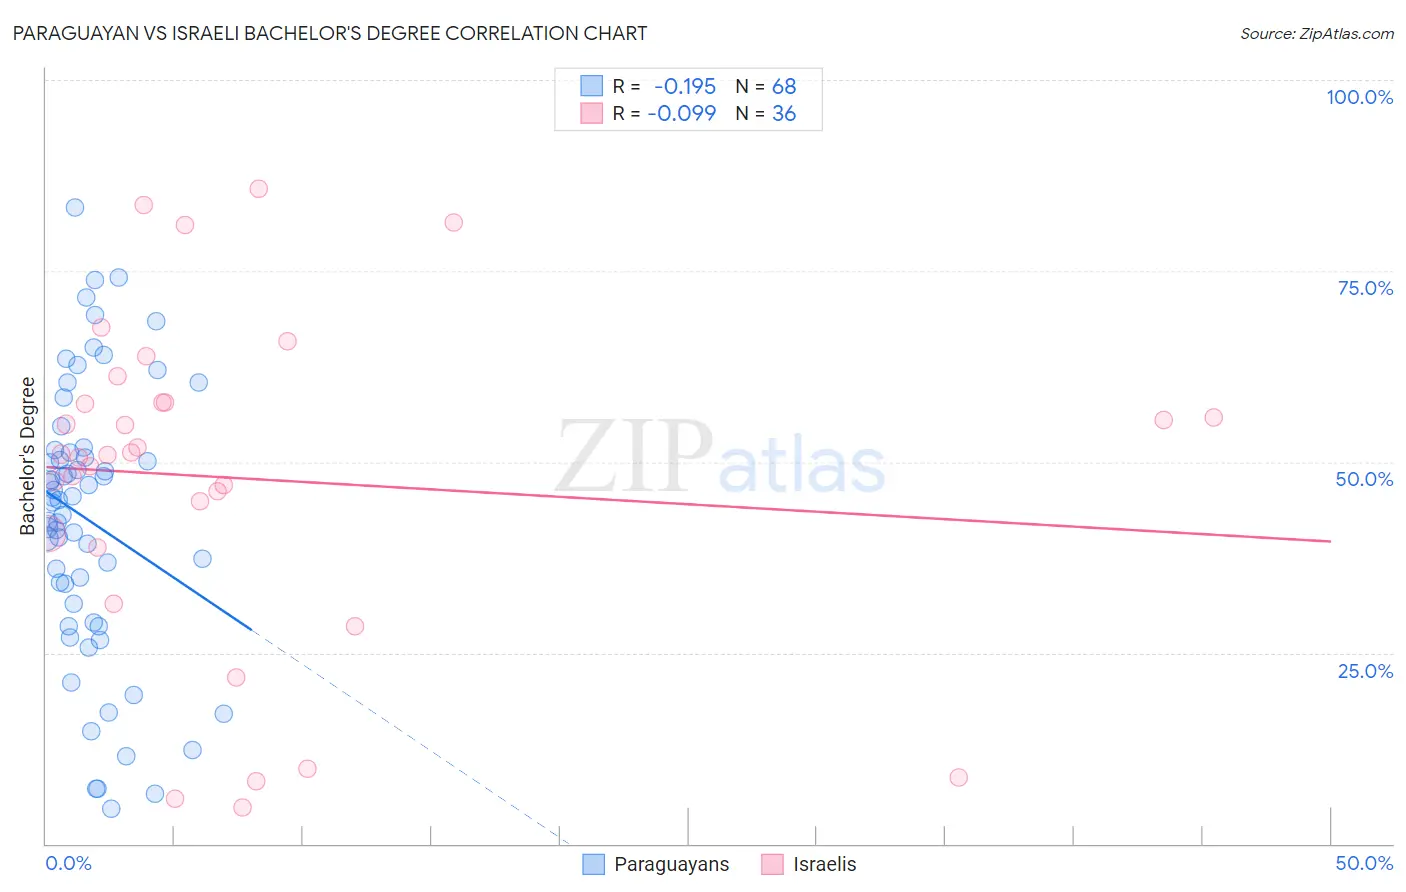
Paraguayan vs Israeli Bachelor's Degree Correlation Chart
The statistical analysis conducted on geographies consisting of 95,113,072 people shows a poor negative correlation between the proportion of Paraguayans and percentage of population with at least bachelor's degree education in the United States with a correlation coefficient (R) of -0.195 and weighted average of 44.0%. Similarly, the statistical analysis conducted on geographies consisting of 211,181,200 people shows a slight negative correlation between the proportion of Israelis and percentage of population with at least bachelor's degree education in the United States with a correlation coefficient (R) of -0.099 and weighted average of 46.1%, a difference of 4.7%.
Bachelor's Degree Correlation Summary
| Measurement | Paraguayan | Israeli |
| Minimum | 4.5% | 4.8% |
| Maximum | 83.2% | 85.8% |
| Range | 78.7% | 80.9% |
| Mean | 42.3% | 47.8% |
| Median | 44.9% | 51.0% |
| Interquartile 25% (IQ1) | 30.2% | 39.7% |
| Interquartile 75% (IQ3) | 51.4% | 57.8% |
| Interquartile Range (IQR) | 21.2% | 18.1% |
| Standard Deviation (Sample) | 18.1% | 21.6% |
| Standard Deviation (Population) | 17.9% | 21.3% |
Similar Demographics by Bachelor's Degree
Demographics Similar to Paraguayans by Bachelor's Degree
In terms of bachelor's degree, the demographic groups most similar to Paraguayans are Immigrants from Czechoslovakia (44.0%, a difference of 0.050%), Australian (44.0%, a difference of 0.16%), New Zealander (44.0%, a difference of 0.16%), Immigrants from Serbia (44.1%, a difference of 0.19%), and Immigrants from Austria (44.2%, a difference of 0.37%).
| Demographics | Rating | Rank | Bachelor's Degree |
| Immigrants | Greece | 99.9 /100 | #50 | Exceptional 44.5% |
| Asians | 99.9 /100 | #51 | Exceptional 44.4% |
| Immigrants | Spain | 99.9 /100 | #52 | Exceptional 44.3% |
| Immigrants | Asia | 99.9 /100 | #53 | Exceptional 44.3% |
| Immigrants | Austria | 99.9 /100 | #54 | Exceptional 44.2% |
| Immigrants | Bolivia | 99.9 /100 | #55 | Exceptional 44.2% |
| Immigrants | Serbia | 99.9 /100 | #56 | Exceptional 44.1% |
| Paraguayans | 99.9 /100 | #57 | Exceptional 44.0% |
| Immigrants | Czechoslovakia | 99.9 /100 | #58 | Exceptional 44.0% |
| Australians | 99.9 /100 | #59 | Exceptional 44.0% |
| New Zealanders | 99.9 /100 | #60 | Exceptional 44.0% |
| South Africans | 99.8 /100 | #61 | Exceptional 43.6% |
| Immigrants | Kazakhstan | 99.8 /100 | #62 | Exceptional 43.4% |
| Immigrants | Europe | 99.8 /100 | #63 | Exceptional 43.4% |
| Argentineans | 99.7 /100 | #64 | Exceptional 43.3% |
Demographics Similar to Israelis by Bachelor's Degree
In terms of bachelor's degree, the demographic groups most similar to Israelis are Immigrants from Sri Lanka (46.1%, a difference of 0.050%), Latvian (46.1%, a difference of 0.090%), Turkish (46.2%, a difference of 0.13%), Immigrants from Turkey (46.0%, a difference of 0.39%), and Immigrants from France (46.4%, a difference of 0.59%).
| Demographics | Rating | Rank | Bachelor's Degree |
| Immigrants | Belgium | 100.0 /100 | #22 | Exceptional 47.0% |
| Immigrants | Sweden | 100.0 /100 | #23 | Exceptional 47.0% |
| Immigrants | Korea | 100.0 /100 | #24 | Exceptional 47.0% |
| Burmese | 100.0 /100 | #25 | Exceptional 46.9% |
| Immigrants | Japan | 100.0 /100 | #26 | Exceptional 46.8% |
| Immigrants | France | 100.0 /100 | #27 | Exceptional 46.4% |
| Turks | 100.0 /100 | #28 | Exceptional 46.2% |
| Israelis | 100.0 /100 | #29 | Exceptional 46.1% |
| Immigrants | Sri Lanka | 100.0 /100 | #30 | Exceptional 46.1% |
| Latvians | 100.0 /100 | #31 | Exceptional 46.1% |
| Immigrants | Turkey | 100.0 /100 | #32 | Exceptional 46.0% |
| Immigrants | Northern Europe | 100.0 /100 | #33 | Exceptional 45.6% |
| Immigrants | Denmark | 100.0 /100 | #34 | Exceptional 45.4% |
| Immigrants | Russia | 100.0 /100 | #35 | Exceptional 45.4% |
| Mongolians | 100.0 /100 | #36 | Exceptional 45.4% |