Panamanian vs Immigrants from Guyana College, 1 year or more

COMPARE

Panamanian
Race
Ancestry
AfghanAfricanAlaska NativeAlaskan AthabascanAlbanianAleutAlsatianAmericanApacheArabArapahoArgentineanArmenianAssyrian/Chaldean/SyriacAustralianAustrianBahamianBangladeshiBarbadianBasqueBelgianBelizeanBermudanBhutaneseBlackfeetBolivianBrazilianBritishBritish West IndianBulgarianBurmeseCajunCambodianCanadianCape VerdeanCarpatho RusynCelticCentral AmericanCentral American IndianCherokeeCheyenneChickasawChileanChineseChippewaChoctawColombianColvilleComancheCosta RicanCreeCreekCroatianCrowCubanCypriotCzechCzechoslovakianDanishDelawareDominicanDutchDutch West IndianEastern EuropeanEcuadorianEgyptianEnglishEstonianEthiopianEuropeanFijianFilipinoFinnishFrenchFrench American IndianFrench CanadianGermanGerman RussianGhanaianGreekGuamanian/ChamorroGuatemalanGuyaneseHaitianHmongHonduranHopiHoumaHungarianIcelanderIndian (Asian)IndonesianInupiatIranianIraqiIrishIroquoisIsraeliItalianJamaicanJapaneseJordanianKenyanKiowaKoreanLaotianLatvianLebaneseLiberianLithuanianLumbeeLuxembourgerMacedonianMalaysianMalteseMarshalleseMenomineeMexicanMexican American IndianMongolianMoroccanNative HawaiianNavajoNepaleseNew ZealanderNicaraguanNigerianNorthern EuropeanNorwegianOkinawanOsageOttawaPaiutePakistaniPalestinianPanamanianParaguayanPennsylvania GermanPeruvianPimaPolishPortuguesePotawatomiPuebloPuerto RicanPuget Sound SalishRomanianRussianSalvadoranSamoanScandinavianScotch-IrishScottishSeminoleSenegaleseSerbianShoshoneSierra LeoneanSiouxSlavicSlovakSloveneSomaliSouth AfricanSouth AmericanSouth American IndianSoviet UnionSpaniardSpanishSpanish AmericanSpanish American IndianSri LankanSubsaharan AfricanSudaneseSwedishSwissSyrianTaiwaneseThaiTlingit-HaidaTohono O'OdhamTonganTrinidadian and TobagonianTsimshianTurkishU.S. Virgin IslanderUgandanUkrainianUruguayanUteVenezuelanVietnameseWelshWest IndianYakamaYaquiYugoslavianYumanYup'ikZimbabwean
Immigration
NonimmigrantsImmigrantsAfghanistanAfricaAlbaniaArgentinaArmeniaAsiaAustraliaAustriaBahamasBangladeshBarbadosBelarusBelgiumBelizeBoliviaBosnia and HerzegovinaBrazilBulgariaBurma/MyanmarCabo VerdeCambodiaCameroonCanadaCaribbeanCentral AmericaChileChinaColombiaCongoCosta RicaCroatiaCubaCzechoslovakiaDenmarkDominicaDominican RepublicEastern AfricaEastern AsiaEastern EuropeEcuadorEgyptEl SalvadorEnglandEritreaEthiopiaEuropeFijiFranceGermanyGhanaGreeceGrenadaGuatemalaHaitiHondurasHong KongHungaryIndiaIndonesiaIranIraqIrelandIsraelItalyJamaicaJapanJordanKazakhstanKenyaKoreaKuwaitLaosLatin AmericaLatviaLebanonLiberiaLithuaniaMalaysiaMexicoMicronesiaMiddle AfricaMoldovaMoroccoNepalNetherlandsNicaraguaNigeriaNorth AmericaNorth MacedoniaNorthern AfricaNorthern EuropeNorwayOceaniaPakistanPanamaPeruPhilippinesPolandPortugalRomaniaRussiaSaudi ArabiaScotlandSenegalSerbiaSierra LeoneSingaporeSomaliaSouth AfricaSouth AmericaSouth Central AsiaSouth Eastern AsiaSouthern EuropeSpainSri LankaSt. Vincent and the GrenadinesSudanSwedenSwitzerlandSyriaTaiwanThailandTrinidad and TobagoTurkeyUgandaUkraineUruguayUzbekistanVenezuelaVietnamWest IndiesWestern AfricaWestern AsiaWestern EuropeYemenZaireZimbabweAzores
Immigrants from Guyana
Race
Ancestry
AfghanAfricanAlaska NativeAlaskan AthabascanAlbanianAleutAlsatianAmericanApacheArabArapahoArgentineanArmenianAssyrian/Chaldean/SyriacAustralianAustrianBahamianBangladeshiBarbadianBasqueBelgianBelizeanBermudanBhutaneseBlackfeetBolivianBrazilianBritishBritish West IndianBulgarianBurmeseCajunCambodianCanadianCape VerdeanCarpatho RusynCelticCentral AmericanCentral American IndianCherokeeCheyenneChickasawChileanChineseChippewaChoctawColombianColvilleComancheCosta RicanCreeCreekCroatianCrowCubanCypriotCzechCzechoslovakianDanishDelawareDominicanDutchDutch West IndianEastern EuropeanEcuadorianEgyptianEnglishEstonianEthiopianEuropeanFijianFilipinoFinnishFrenchFrench American IndianFrench CanadianGermanGerman RussianGhanaianGreekGuamanian/ChamorroGuatemalanGuyaneseHaitianHmongHonduranHopiHoumaHungarianIcelanderIndian (Asian)IndonesianInupiatIranianIraqiIrishIroquoisIsraeliItalianJamaicanJapaneseJordanianKenyanKiowaKoreanLaotianLatvianLebaneseLiberianLithuanianLumbeeLuxembourgerMacedonianMalaysianMalteseMarshalleseMenomineeMexicanMexican American IndianMongolianMoroccanNative HawaiianNavajoNepaleseNew ZealanderNicaraguanNigerianNorthern EuropeanNorwegianOkinawanOsageOttawaPaiutePakistaniPalestinianParaguayanPennsylvania GermanPeruvianPimaPolishPortuguesePotawatomiPuebloPuerto RicanPuget Sound SalishRomanianRussianSalvadoranSamoanScandinavianScotch-IrishScottishSeminoleSenegaleseSerbianShoshoneSierra LeoneanSiouxSlavicSlovakSloveneSomaliSouth AfricanSouth AmericanSouth American IndianSoviet UnionSpaniardSpanishSpanish AmericanSpanish American IndianSri LankanSubsaharan AfricanSudaneseSwedishSwissSyrianTaiwaneseThaiTlingit-HaidaTohono O'OdhamTonganTrinidadian and TobagonianTsimshianTurkishU.S. Virgin IslanderUgandanUkrainianUruguayanUteVenezuelanVietnameseWelshWest IndianYakamaYaquiYugoslavianYumanYup'ikZimbabwean
Immigration
NonimmigrantsImmigrantsAfghanistanAfricaAlbaniaArgentinaArmeniaAsiaAustraliaAustriaBahamasBangladeshBarbadosBelarusBelgiumBelizeBoliviaBosnia and HerzegovinaBrazilBulgariaBurma/MyanmarCabo VerdeCambodiaCameroonCanadaCaribbeanCentral AmericaChileChinaColombiaCongoCosta RicaCroatiaCubaCzechoslovakiaDenmarkDominicaDominican RepublicEastern AfricaEastern AsiaEastern EuropeEcuadorEgyptEl SalvadorEnglandEritreaEthiopiaEuropeFijiFranceGermanyGhanaGreeceGrenadaGuatemalaGuyanaHaitiHondurasHong KongHungaryIndiaIndonesiaIranIraqIrelandIsraelItalyJamaicaJapanJordanKazakhstanKenyaKoreaKuwaitLaosLatin AmericaLatviaLebanonLiberiaLithuaniaMalaysiaMexicoMicronesiaMiddle AfricaMoldovaMoroccoNepalNetherlandsNicaraguaNigeriaNorth AmericaNorth MacedoniaNorthern AfricaNorthern EuropeNorwayOceaniaPakistanPanamaPeruPhilippinesPolandPortugalRomaniaRussiaSaudi ArabiaScotlandSenegalSerbiaSierra LeoneSingaporeSomaliaSouth AfricaSouth AmericaSouth Central AsiaSouth Eastern AsiaSouthern EuropeSpainSri LankaSt. Vincent and the GrenadinesSudanSwedenSwitzerlandSyriaTaiwanThailandTrinidad and TobagoTurkeyUgandaUkraineUruguayUzbekistanVenezuelaVietnamWest IndiesWestern AfricaWestern AsiaWestern EuropeYemenZaireZimbabweAzores
College, 1 year or more
Income
Poverty
Unemployment
Labor Participation
Family Structure
Vehicle Availability
Education Level
Disability

College, 1 year or more Comparison

Panamanians

Immigrants from Guyana

Poor
Tragic
58.3%
COLLEGE, 1 YEAR OR MORE
19.2/ 100
METRIC RATING
204th/ 347
METRIC RANK
53.5%
COLLEGE, 1 YEAR OR MORE
0.1/ 100
METRIC RATING
285th/ 347
METRIC RANK

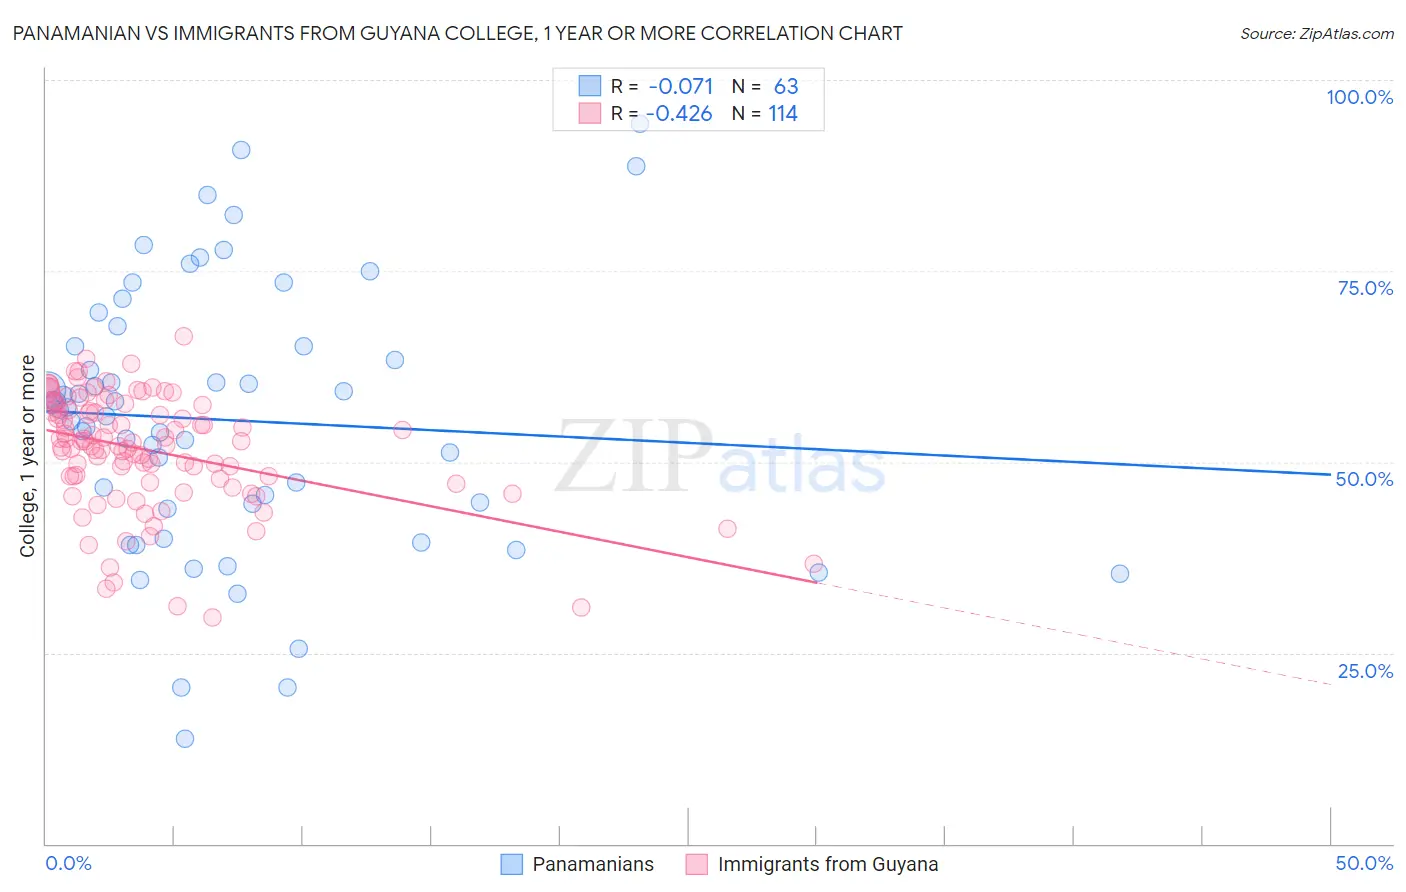
Panamanian vs Immigrants from Guyana College, 1 year or more Correlation Chart

The statistical analysis conducted on geographies consisting of 281,250,786 people shows a slight negative correlation between the proportion of Panamanians and percentage of population with at least college, 1 year or more education in the United States with a correlation coefficient (R) of -0.071 and weighted average of 58.3%. Similarly, the statistical analysis conducted on geographies consisting of 183,735,121 people shows a moderate negative correlation between the proportion of Immigrants from Guyana and percentage of population with at least college, 1 year or more education in the United States with a correlation coefficient (R) of -0.426 and weighted average of 53.5%, a difference of 8.8%.
Panamanian vs Immigrants from Guyana College, 1 year or more

College, 1 year or more Correlation Summary

MeasurementPanamanianImmigrants from Guyana
Minimum13.8%29.6%
Maximum94.2%66.5%
Range80.4%36.8%
Mean55.5%51.5%
Median56.8%52.6%
Interquartile 25% (IQ1)43.9%47.8%
Interquartile 75% (IQ3)65.2%57.0%
Interquartile Range (IQR)21.3%9.2%
Standard Deviation (Sample)17.5%7.4%
Standard Deviation (Population)17.4%7.4%

Similar Demographics by College, 1 year or more

Demographics Similar to Panamanians by College, 1 year or more

In terms of college, 1 year or more, the demographic groups most similar to Panamanians are Immigrants from Zaire (58.3%, a difference of 0.050%), Immigrants from Vietnam (58.2%, a difference of 0.090%), Ghanaian (58.4%, a difference of 0.14%), Senegalese (58.2%, a difference of 0.21%), and Immigrants from South America (58.4%, a difference of 0.23%).
DemographicsRating | RankCollege, 1 year or more
Immigrants | Thailand
26.0
/100
|
#197
Fair
58.6%
Immigrants | South Eastern Asia
25.1
/100
|
#198
Fair
58.5%
Slovaks
24.6
/100
|
#199
Fair
58.5%
Spanish
24.2
/100
|
#200
Fair
58.5%
Nigerians
23.0
/100
|
#201
Fair
58.5%
Immigrants | South America
21.9
/100
|
#202
Fair
58.4%
Ghanaians
20.9
/100
|
#203
Fair
58.4%
Panamanians
19.2
/100
|
#204
Poor
58.3%
Immigrants | Zaire
18.7
/100
|
#205
Poor
58.3%
Immigrants | Vietnam
18.2
/100
|
#206
Poor
58.2%
Senegalese
16.9
/100
|
#207
Poor
58.2%
Immigrants | Uruguay
15.2
/100
|
#208
Poor
58.1%
Immigrants | Middle Africa
14.0
/100
|
#209
Poor
58.0%
Tsimshian
13.5
/100
|
#210
Poor
57.9%
Immigrants | Nigeria
13.3
/100
|
#211
Poor
57.9%

Demographics Similar to Immigrants from Guyana by College, 1 year or more

In terms of college, 1 year or more, the demographic groups most similar to Immigrants from Guyana are Central American Indian (53.5%, a difference of 0.040%), Immigrants from Belize (53.5%, a difference of 0.080%), Alaska Native (53.4%, a difference of 0.25%), Immigrants from Ecuador (53.4%, a difference of 0.25%), and Alaskan Athabascan (53.4%, a difference of 0.27%).
DemographicsRating | RankCollege, 1 year or more
Immigrants | Jamaica
0.1
/100
|
#278
Tragic
54.2%
Arapaho
0.1
/100
|
#279
Tragic
54.1%
Cheyenne
0.1
/100
|
#280
Tragic
54.1%
Colville
0.1
/100
|
#281
Tragic
54.1%
Guyanese
0.1
/100
|
#282
Tragic
54.1%
Nicaraguans
0.1
/100
|
#283
Tragic
53.9%
Ute
0.1
/100
|
#284
Tragic
53.8%
Immigrants | Guyana
0.1
/100
|
#285
Tragic
53.5%
Central American Indians
0.1
/100
|
#286
Tragic
53.5%
Immigrants | Belize
0.1
/100
|
#287
Tragic
53.5%
Alaska Natives
0.0
/100
|
#288
Tragic
53.4%
Immigrants | Ecuador
0.0
/100
|
#289
Tragic
53.4%
Alaskan Athabascans
0.0
/100
|
#290
Tragic
53.4%
Cubans
0.0
/100
|
#291
Tragic
53.4%
Chickasaw
0.0
/100
|
#292
Tragic
53.3%