Paiute vs Pakistani College, 1 year or more
COMPARE
Paiute
Pakistani
College, 1 year or more
College, 1 year or more Comparison
Paiute
Pakistanis
52.9%
COLLEGE, 1 YEAR OR MORE
0.0/ 100
METRIC RATING
297th/ 347
METRIC RANK
61.5%
COLLEGE, 1 YEAR OR MORE
93.2/ 100
METRIC RATING
120th/ 347
METRIC RANK
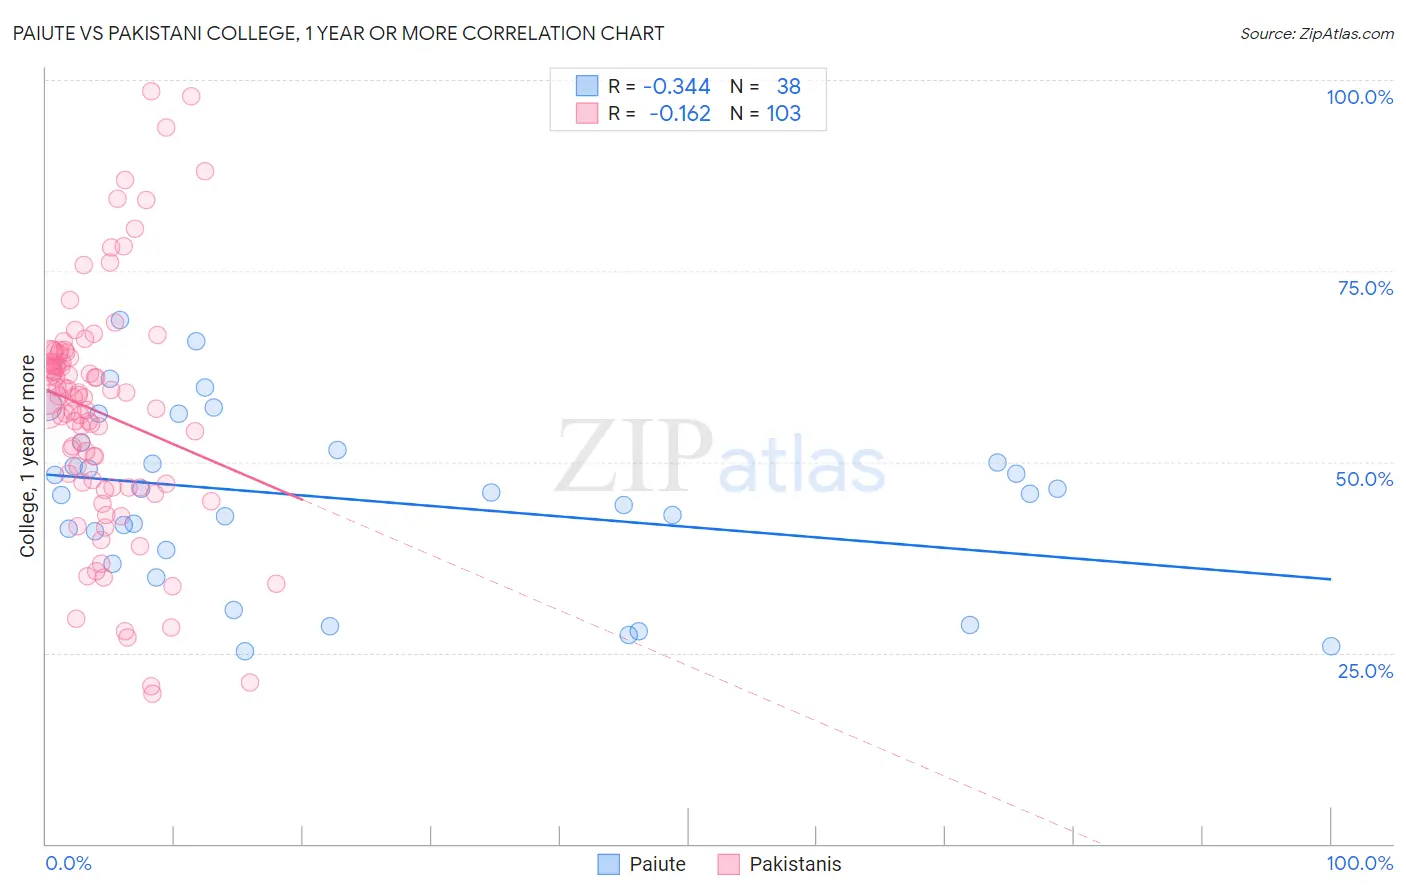
Paiute vs Pakistani College, 1 year or more Correlation Chart
The statistical analysis conducted on geographies consisting of 58,404,248 people shows a mild negative correlation between the proportion of Paiute and percentage of population with at least college, 1 year or more education in the United States with a correlation coefficient (R) of -0.344 and weighted average of 52.9%. Similarly, the statistical analysis conducted on geographies consisting of 335,356,650 people shows a poor negative correlation between the proportion of Pakistanis and percentage of population with at least college, 1 year or more education in the United States with a correlation coefficient (R) of -0.162 and weighted average of 61.5%, a difference of 16.3%.
College, 1 year or more Correlation Summary
| Measurement | Paiute | Pakistani |
| Minimum | 25.3% | 19.6% |
| Maximum | 68.6% | 98.6% |
| Range | 43.4% | 79.0% |
| Mean | 45.0% | 56.5% |
| Median | 45.9% | 58.5% |
| Interquartile 25% (IQ1) | 38.5% | 46.7% |
| Interquartile 75% (IQ3) | 51.5% | 64.1% |
| Interquartile Range (IQR) | 13.0% | 17.4% |
| Standard Deviation (Sample) | 11.2% | 15.7% |
| Standard Deviation (Population) | 11.0% | 15.6% |
Similar Demographics by College, 1 year or more
Demographics Similar to Paiute by College, 1 year or more
In terms of college, 1 year or more, the demographic groups most similar to Paiute are Sioux (53.0%, a difference of 0.28%), Immigrants from Dominica (52.5%, a difference of 0.59%), Yaqui (53.2%, a difference of 0.62%), Cherokee (53.2%, a difference of 0.63%), and Black/African American (53.3%, a difference of 0.84%).
| Demographics | Rating | Rank | College, 1 year or more |
| Alaskan Athabascans | 0.0 /100 | #290 | Tragic 53.4% |
| Cubans | 0.0 /100 | #291 | Tragic 53.4% |
| Chickasaw | 0.0 /100 | #292 | Tragic 53.3% |
| Blacks/African Americans | 0.0 /100 | #293 | Tragic 53.3% |
| Cherokee | 0.0 /100 | #294 | Tragic 53.2% |
| Yaqui | 0.0 /100 | #295 | Tragic 53.2% |
| Sioux | 0.0 /100 | #296 | Tragic 53.0% |
| Paiute | 0.0 /100 | #297 | Tragic 52.9% |
| Immigrants | Dominica | 0.0 /100 | #298 | Tragic 52.5% |
| Immigrants | Nicaragua | 0.0 /100 | #299 | Tragic 52.4% |
| Choctaw | 0.0 /100 | #300 | Tragic 52.3% |
| Haitians | 0.0 /100 | #301 | Tragic 52.3% |
| Puerto Ricans | 0.0 /100 | #302 | Tragic 52.2% |
| Creek | 0.0 /100 | #303 | Tragic 52.2% |
| Central Americans | 0.0 /100 | #304 | Tragic 52.1% |
Demographics Similar to Pakistanis by College, 1 year or more
In terms of college, 1 year or more, the demographic groups most similar to Pakistanis are Assyrian/Chaldean/Syriac (61.5%, a difference of 0.0%), Immigrants from Jordan (61.4%, a difference of 0.10%), Arab (61.6%, a difference of 0.14%), Immigrants from Brazil (61.6%, a difference of 0.14%), and Lebanese (61.6%, a difference of 0.18%).
| Demographics | Rating | Rank | College, 1 year or more |
| Ukrainians | 95.2 /100 | #113 | Exceptional 61.8% |
| Danes | 94.8 /100 | #114 | Exceptional 61.7% |
| Norwegians | 94.5 /100 | #115 | Exceptional 61.7% |
| Lebanese | 94.1 /100 | #116 | Exceptional 61.6% |
| Arabs | 93.9 /100 | #117 | Exceptional 61.6% |
| Immigrants | Brazil | 93.9 /100 | #118 | Exceptional 61.6% |
| Assyrians/Chaldeans/Syriacs | 93.3 /100 | #119 | Exceptional 61.5% |
| Pakistanis | 93.2 /100 | #120 | Exceptional 61.5% |
| Immigrants | Jordan | 92.7 /100 | #121 | Exceptional 61.4% |
| Immigrants | Chile | 92.3 /100 | #122 | Exceptional 61.4% |
| Serbians | 92.2 /100 | #123 | Exceptional 61.4% |
| Venezuelans | 92.1 /100 | #124 | Exceptional 61.3% |
| Immigrants | Syria | 91.6 /100 | #125 | Exceptional 61.3% |
| Alsatians | 91.3 /100 | #126 | Exceptional 61.3% |
| Immigrants | Eastern Africa | 91.1 /100 | #127 | Exceptional 61.2% |