Paiute vs Celtic College, 1 year or more
COMPARE
Paiute
Celtic
College, 1 year or more
College, 1 year or more Comparison
Paiute
Celtics
52.9%
COLLEGE, 1 YEAR OR MORE
0.0/ 100
METRIC RATING
297th/ 347
METRIC RANK
59.4%
COLLEGE, 1 YEAR OR MORE
50.0/ 100
METRIC RATING
174th/ 347
METRIC RANK
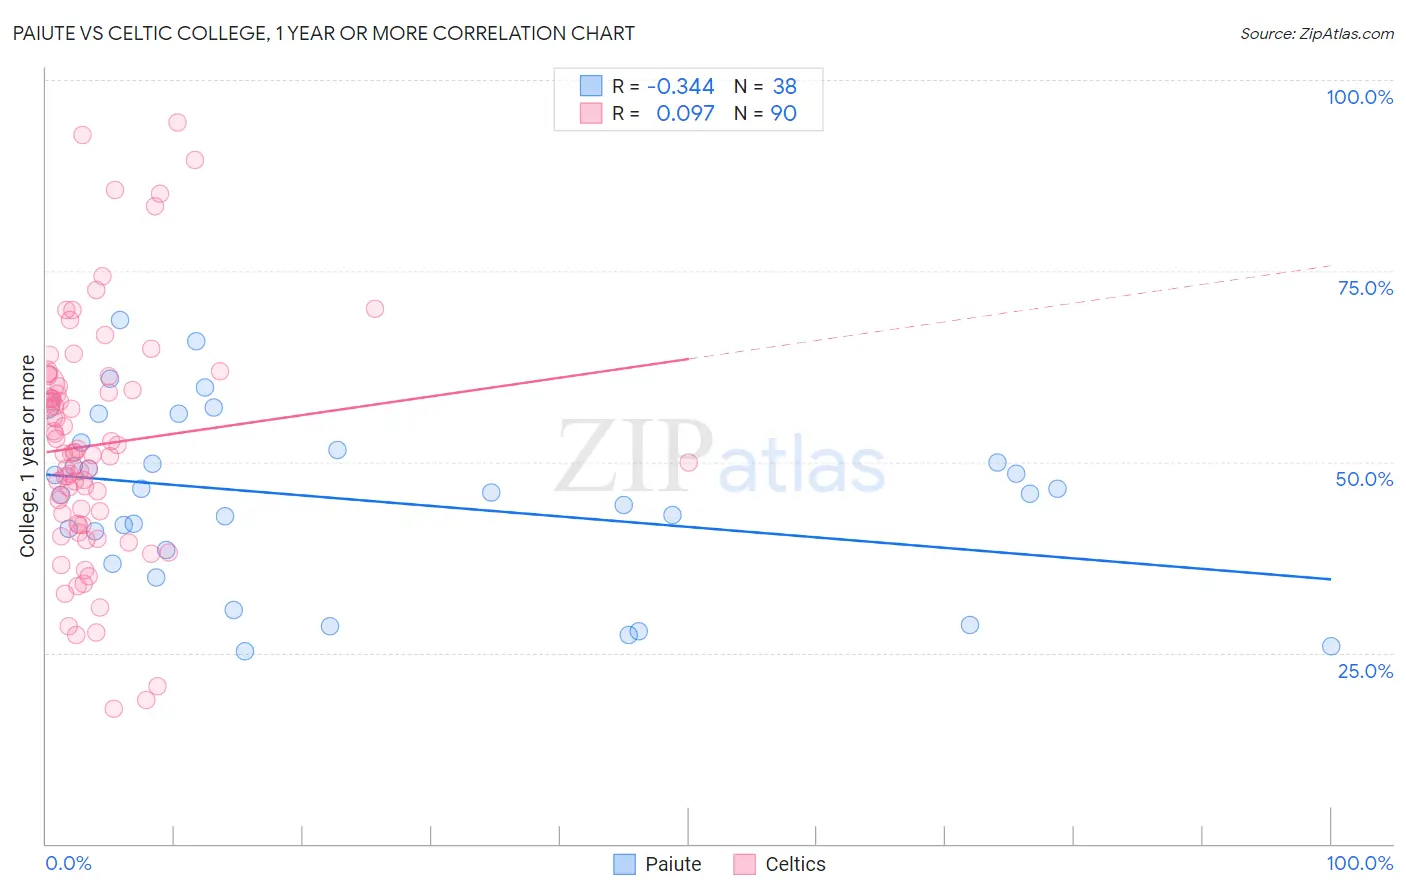
Paiute vs Celtic College, 1 year or more Correlation Chart
The statistical analysis conducted on geographies consisting of 58,404,248 people shows a mild negative correlation between the proportion of Paiute and percentage of population with at least college, 1 year or more education in the United States with a correlation coefficient (R) of -0.344 and weighted average of 52.9%. Similarly, the statistical analysis conducted on geographies consisting of 168,877,347 people shows a slight positive correlation between the proportion of Celtics and percentage of population with at least college, 1 year or more education in the United States with a correlation coefficient (R) of 0.097 and weighted average of 59.4%, a difference of 12.4%.
College, 1 year or more Correlation Summary
| Measurement | Paiute | Celtic |
| Minimum | 25.3% | 17.6% |
| Maximum | 68.6% | 94.4% |
| Range | 43.4% | 76.8% |
| Mean | 45.0% | 52.2% |
| Median | 45.9% | 51.2% |
| Interquartile 25% (IQ1) | 38.5% | 41.8% |
| Interquartile 75% (IQ3) | 51.5% | 59.9% |
| Interquartile Range (IQR) | 13.0% | 18.0% |
| Standard Deviation (Sample) | 11.2% | 15.4% |
| Standard Deviation (Population) | 11.0% | 15.4% |
Similar Demographics by College, 1 year or more
Demographics Similar to Paiute by College, 1 year or more
In terms of college, 1 year or more, the demographic groups most similar to Paiute are Sioux (53.0%, a difference of 0.28%), Immigrants from Dominica (52.5%, a difference of 0.59%), Yaqui (53.2%, a difference of 0.62%), Cherokee (53.2%, a difference of 0.63%), and Black/African American (53.3%, a difference of 0.84%).
| Demographics | Rating | Rank | College, 1 year or more |
| Alaskan Athabascans | 0.0 /100 | #290 | Tragic 53.4% |
| Cubans | 0.0 /100 | #291 | Tragic 53.4% |
| Chickasaw | 0.0 /100 | #292 | Tragic 53.3% |
| Blacks/African Americans | 0.0 /100 | #293 | Tragic 53.3% |
| Cherokee | 0.0 /100 | #294 | Tragic 53.2% |
| Yaqui | 0.0 /100 | #295 | Tragic 53.2% |
| Sioux | 0.0 /100 | #296 | Tragic 53.0% |
| Paiute | 0.0 /100 | #297 | Tragic 52.9% |
| Immigrants | Dominica | 0.0 /100 | #298 | Tragic 52.5% |
| Immigrants | Nicaragua | 0.0 /100 | #299 | Tragic 52.4% |
| Choctaw | 0.0 /100 | #300 | Tragic 52.3% |
| Haitians | 0.0 /100 | #301 | Tragic 52.3% |
| Puerto Ricans | 0.0 /100 | #302 | Tragic 52.2% |
| Creek | 0.0 /100 | #303 | Tragic 52.2% |
| Central Americans | 0.0 /100 | #304 | Tragic 52.1% |
Demographics Similar to Celtics by College, 1 year or more
In terms of college, 1 year or more, the demographic groups most similar to Celtics are Sri Lankan (59.4%, a difference of 0.050%), Immigrants from Oceania (59.4%, a difference of 0.060%), Immigrants from Poland (59.4%, a difference of 0.060%), Tlingit-Haida (59.4%, a difference of 0.080%), and Czechoslovakian (59.4%, a difference of 0.090%).
| Demographics | Rating | Rank | College, 1 year or more |
| Immigrants | North Macedonia | 53.1 /100 | #167 | Average 59.5% |
| Hungarians | 52.9 /100 | #168 | Average 59.5% |
| Immigrants | Southern Europe | 52.7 /100 | #169 | Average 59.5% |
| Welsh | 52.4 /100 | #170 | Average 59.5% |
| Immigrants | Albania | 52.3 /100 | #171 | Average 59.5% |
| Immigrants | Sierra Leone | 52.2 /100 | #172 | Average 59.5% |
| Immigrants | Oceania | 51.2 /100 | #173 | Average 59.4% |
| Celtics | 50.0 /100 | #174 | Average 59.4% |
| Sri Lankans | 49.0 /100 | #175 | Average 59.4% |
| Immigrants | Poland | 48.9 /100 | #176 | Average 59.4% |
| Tlingit-Haida | 48.4 /100 | #177 | Average 59.4% |
| Czechoslovakians | 48.3 /100 | #178 | Average 59.4% |
| Bermudans | 46.6 /100 | #179 | Average 59.3% |
| Yugoslavians | 44.1 /100 | #180 | Average 59.2% |
| Swiss | 43.4 /100 | #181 | Average 59.2% |