Paiute vs Immigrants from Cuba No Schooling Completed
COMPARE
Paiute
Immigrants from Cuba
No Schooling Completed
No Schooling Completed Comparison
Paiute
Immigrants from Cuba
2.4%
NO SCHOOLING COMPLETED
1.9/ 100
METRIC RATING
238th/ 347
METRIC RANK
2.8%
NO SCHOOLING COMPLETED
0.0/ 100
METRIC RATING
297th/ 347
METRIC RANK
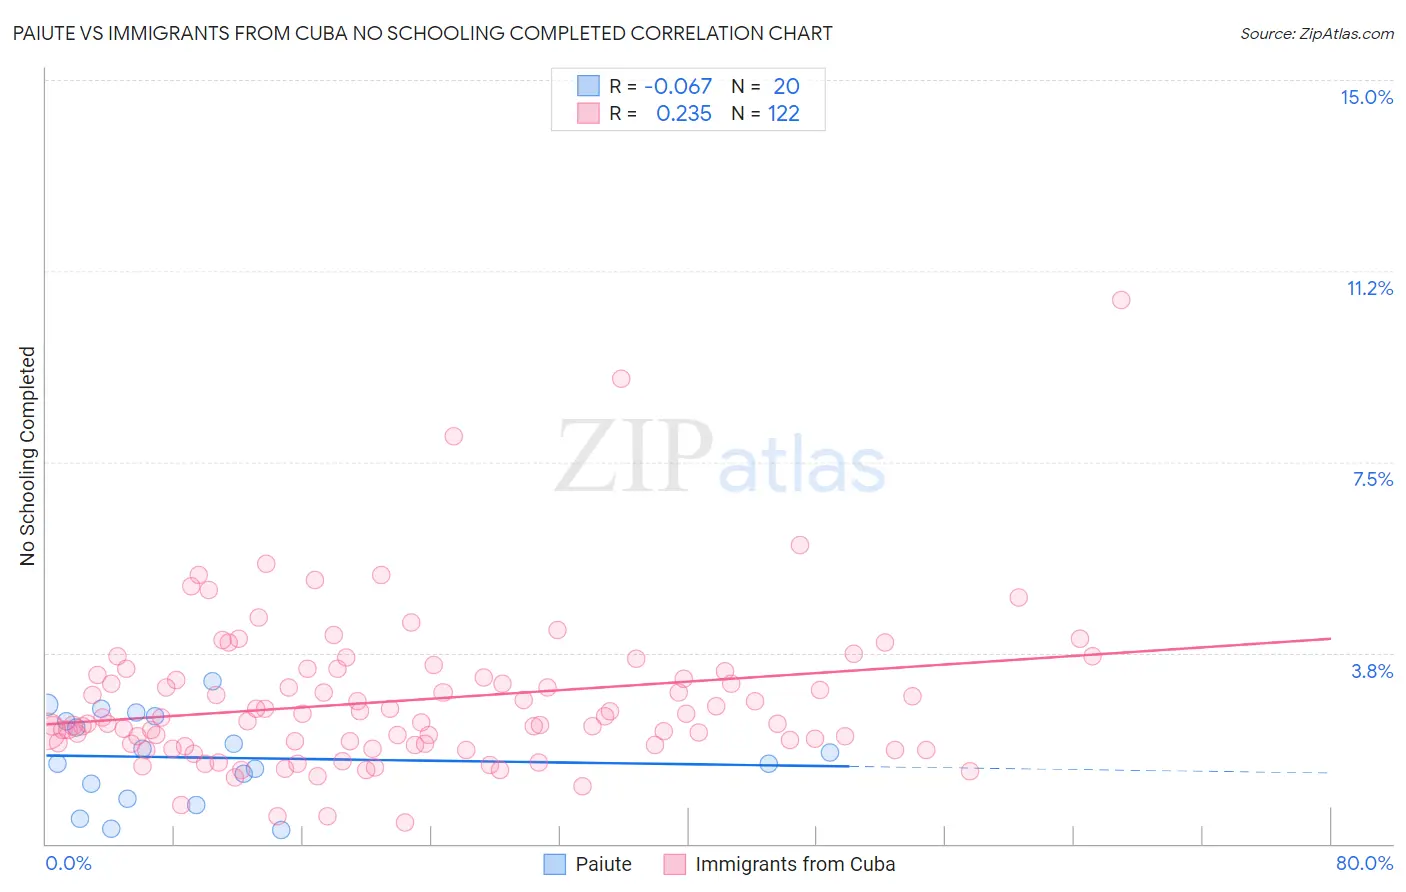
Paiute vs Immigrants from Cuba No Schooling Completed Correlation Chart
The statistical analysis conducted on geographies consisting of 58,130,923 people shows a slight negative correlation between the proportion of Paiute and percentage of population with no schooling in the United States with a correlation coefficient (R) of -0.067 and weighted average of 2.4%. Similarly, the statistical analysis conducted on geographies consisting of 324,009,430 people shows a weak positive correlation between the proportion of Immigrants from Cuba and percentage of population with no schooling in the United States with a correlation coefficient (R) of 0.235 and weighted average of 2.8%, a difference of 19.1%.
No Schooling Completed Correlation Summary
| Measurement | Paiute | Immigrants from Cuba |
| Minimum | 0.28% | 0.42% |
| Maximum | 3.2% | 10.7% |
| Range | 2.9% | 10.3% |
| Mean | 1.7% | 2.8% |
| Median | 1.7% | 2.5% |
| Interquartile 25% (IQ1) | 1.0% | 2.0% |
| Interquartile 75% (IQ3) | 2.5% | 3.3% |
| Interquartile Range (IQR) | 1.4% | 1.4% |
| Standard Deviation (Sample) | 0.86% | 1.5% |
| Standard Deviation (Population) | 0.84% | 1.5% |
Similar Demographics by No Schooling Completed
Demographics Similar to Paiute by No Schooling Completed
In terms of no schooling completed, the demographic groups most similar to Paiute are Liberian (2.4%, a difference of 0.12%), Immigrants from Eastern Asia (2.4%, a difference of 0.21%), Immigrants from Senegal (2.4%, a difference of 0.35%), Iraqi (2.4%, a difference of 0.41%), and Korean (2.4%, a difference of 0.41%).
| Demographics | Rating | Rank | No Schooling Completed |
| Immigrants | Uruguay | 3.4 /100 | #231 | Tragic 2.3% |
| Colombians | 3.2 /100 | #232 | Tragic 2.3% |
| Immigrants | Malaysia | 2.8 /100 | #233 | Tragic 2.3% |
| Nigerians | 2.6 /100 | #234 | Tragic 2.3% |
| Immigrants | Western Asia | 2.6 /100 | #235 | Tragic 2.3% |
| Iraqis | 2.2 /100 | #236 | Tragic 2.4% |
| Immigrants | Eastern Asia | 2.0 /100 | #237 | Tragic 2.4% |
| Paiute | 1.9 /100 | #238 | Tragic 2.4% |
| Liberians | 1.8 /100 | #239 | Tragic 2.4% |
| Immigrants | Senegal | 1.7 /100 | #240 | Tragic 2.4% |
| Koreans | 1.7 /100 | #241 | Tragic 2.4% |
| Immigrants | Indonesia | 1.5 /100 | #242 | Tragic 2.4% |
| South Americans | 1.5 /100 | #243 | Tragic 2.4% |
| Peruvians | 1.4 /100 | #244 | Tragic 2.4% |
| Bolivians | 1.4 /100 | #245 | Tragic 2.4% |
Demographics Similar to Immigrants from Cuba by No Schooling Completed
In terms of no schooling completed, the demographic groups most similar to Immigrants from Cuba are Immigrants from Dominica (2.8%, a difference of 0.33%), Central American Indian (2.8%, a difference of 0.84%), Immigrants (2.8%, a difference of 1.1%), Haitian (2.9%, a difference of 1.2%), and Houma (2.8%, a difference of 1.3%).
| Demographics | Rating | Rank | No Schooling Completed |
| Immigrants | Hong Kong | 0.0 /100 | #290 | Tragic 2.7% |
| British West Indians | 0.0 /100 | #291 | Tragic 2.7% |
| Immigrants | Grenada | 0.0 /100 | #292 | Tragic 2.8% |
| Malaysians | 0.0 /100 | #293 | Tragic 2.8% |
| Immigrants | Eritrea | 0.0 /100 | #294 | Tragic 2.8% |
| Houma | 0.0 /100 | #295 | Tragic 2.8% |
| Immigrants | Immigrants | 0.0 /100 | #296 | Tragic 2.8% |
| Immigrants | Cuba | 0.0 /100 | #297 | Tragic 2.8% |
| Immigrants | Dominica | 0.0 /100 | #298 | Tragic 2.8% |
| Central American Indians | 0.0 /100 | #299 | Tragic 2.8% |
| Haitians | 0.0 /100 | #300 | Tragic 2.9% |
| Immigrants | South Eastern Asia | 0.0 /100 | #301 | Tragic 2.9% |
| Immigrants | Caribbean | 0.0 /100 | #302 | Tragic 2.9% |
| Somalis | 0.0 /100 | #303 | Tragic 2.9% |
| Nicaraguans | 0.0 /100 | #304 | Tragic 2.9% |