Paiute vs Ghanaian No Schooling Completed
COMPARE
Paiute
Ghanaian
No Schooling Completed
No Schooling Completed Comparison
Paiute
Ghanaians
2.4%
NO SCHOOLING COMPLETED
1.9/ 100
METRIC RATING
238th/ 347
METRIC RANK
2.6%
NO SCHOOLING COMPLETED
0.1/ 100
METRIC RATING
274th/ 347
METRIC RANK
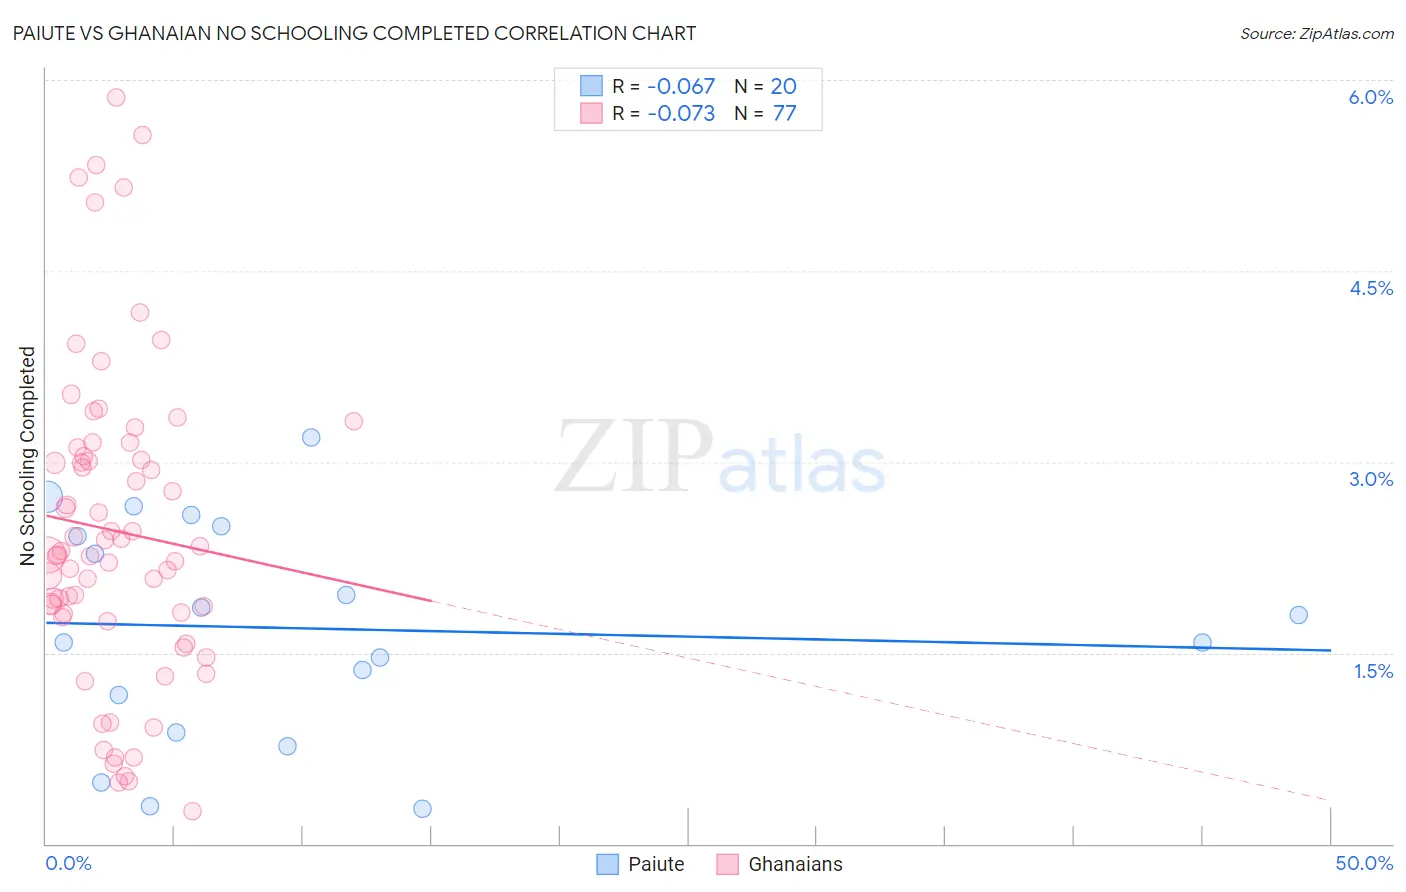
Paiute vs Ghanaian No Schooling Completed Correlation Chart
The statistical analysis conducted on geographies consisting of 58,130,923 people shows a slight negative correlation between the proportion of Paiute and percentage of population with no schooling in the United States with a correlation coefficient (R) of -0.067 and weighted average of 2.4%. Similarly, the statistical analysis conducted on geographies consisting of 189,718,385 people shows a slight negative correlation between the proportion of Ghanaians and percentage of population with no schooling in the United States with a correlation coefficient (R) of -0.073 and weighted average of 2.6%, a difference of 8.0%.
No Schooling Completed Correlation Summary
| Measurement | Paiute | Ghanaian |
| Minimum | 0.28% | 0.26% |
| Maximum | 3.2% | 5.9% |
| Range | 2.9% | 5.6% |
| Mean | 1.7% | 2.5% |
| Median | 1.7% | 2.3% |
| Interquartile 25% (IQ1) | 1.0% | 1.8% |
| Interquartile 75% (IQ3) | 2.5% | 3.1% |
| Interquartile Range (IQR) | 1.4% | 1.3% |
| Standard Deviation (Sample) | 0.86% | 1.2% |
| Standard Deviation (Population) | 0.84% | 1.2% |
Similar Demographics by No Schooling Completed
Demographics Similar to Paiute by No Schooling Completed
In terms of no schooling completed, the demographic groups most similar to Paiute are Liberian (2.4%, a difference of 0.12%), Immigrants from Eastern Asia (2.4%, a difference of 0.21%), Immigrants from Senegal (2.4%, a difference of 0.35%), Iraqi (2.4%, a difference of 0.41%), and Korean (2.4%, a difference of 0.41%).
| Demographics | Rating | Rank | No Schooling Completed |
| Immigrants | Uruguay | 3.4 /100 | #231 | Tragic 2.3% |
| Colombians | 3.2 /100 | #232 | Tragic 2.3% |
| Immigrants | Malaysia | 2.8 /100 | #233 | Tragic 2.3% |
| Nigerians | 2.6 /100 | #234 | Tragic 2.3% |
| Immigrants | Western Asia | 2.6 /100 | #235 | Tragic 2.3% |
| Iraqis | 2.2 /100 | #236 | Tragic 2.4% |
| Immigrants | Eastern Asia | 2.0 /100 | #237 | Tragic 2.4% |
| Paiute | 1.9 /100 | #238 | Tragic 2.4% |
| Liberians | 1.8 /100 | #239 | Tragic 2.4% |
| Immigrants | Senegal | 1.7 /100 | #240 | Tragic 2.4% |
| Koreans | 1.7 /100 | #241 | Tragic 2.4% |
| Immigrants | Indonesia | 1.5 /100 | #242 | Tragic 2.4% |
| South Americans | 1.5 /100 | #243 | Tragic 2.4% |
| Peruvians | 1.4 /100 | #244 | Tragic 2.4% |
| Bolivians | 1.4 /100 | #245 | Tragic 2.4% |
Demographics Similar to Ghanaians by No Schooling Completed
In terms of no schooling completed, the demographic groups most similar to Ghanaians are Immigrants from China (2.6%, a difference of 0.18%), Immigrants from Cameroon (2.5%, a difference of 0.37%), Immigrants from Western Africa (2.6%, a difference of 0.74%), Immigrants from Philippines (2.6%, a difference of 0.80%), and Immigrants from Uzbekistan (2.6%, a difference of 1.0%).
| Demographics | Rating | Rank | No Schooling Completed |
| Yuman | 0.4 /100 | #267 | Tragic 2.5% |
| Taiwanese | 0.3 /100 | #268 | Tragic 2.5% |
| Immigrants | Nigeria | 0.2 /100 | #269 | Tragic 2.5% |
| Immigrants | Peru | 0.2 /100 | #270 | Tragic 2.5% |
| Cubans | 0.2 /100 | #271 | Tragic 2.5% |
| Immigrants | Bolivia | 0.2 /100 | #272 | Tragic 2.5% |
| Immigrants | Cameroon | 0.1 /100 | #273 | Tragic 2.5% |
| Ghanaians | 0.1 /100 | #274 | Tragic 2.6% |
| Immigrants | China | 0.1 /100 | #275 | Tragic 2.6% |
| Immigrants | Western Africa | 0.1 /100 | #276 | Tragic 2.6% |
| Immigrants | Philippines | 0.1 /100 | #277 | Tragic 2.6% |
| Immigrants | Uzbekistan | 0.1 /100 | #278 | Tragic 2.6% |
| Barbadians | 0.1 /100 | #279 | Tragic 2.6% |
| Trinidadians and Tobagonians | 0.1 /100 | #280 | Tragic 2.6% |
| Afghans | 0.1 /100 | #281 | Tragic 2.6% |