Paiute vs Immigrants from Micronesia Professional Degree
COMPARE
Paiute
Immigrants from Micronesia
Professional Degree
Professional Degree Comparison
Paiute
Immigrants from Micronesia
3.4%
PROFESSIONAL DEGREE
0.3/ 100
METRIC RATING
294th/ 347
METRIC RANK
3.2%
PROFESSIONAL DEGREE
0.1/ 100
METRIC RATING
318th/ 347
METRIC RANK
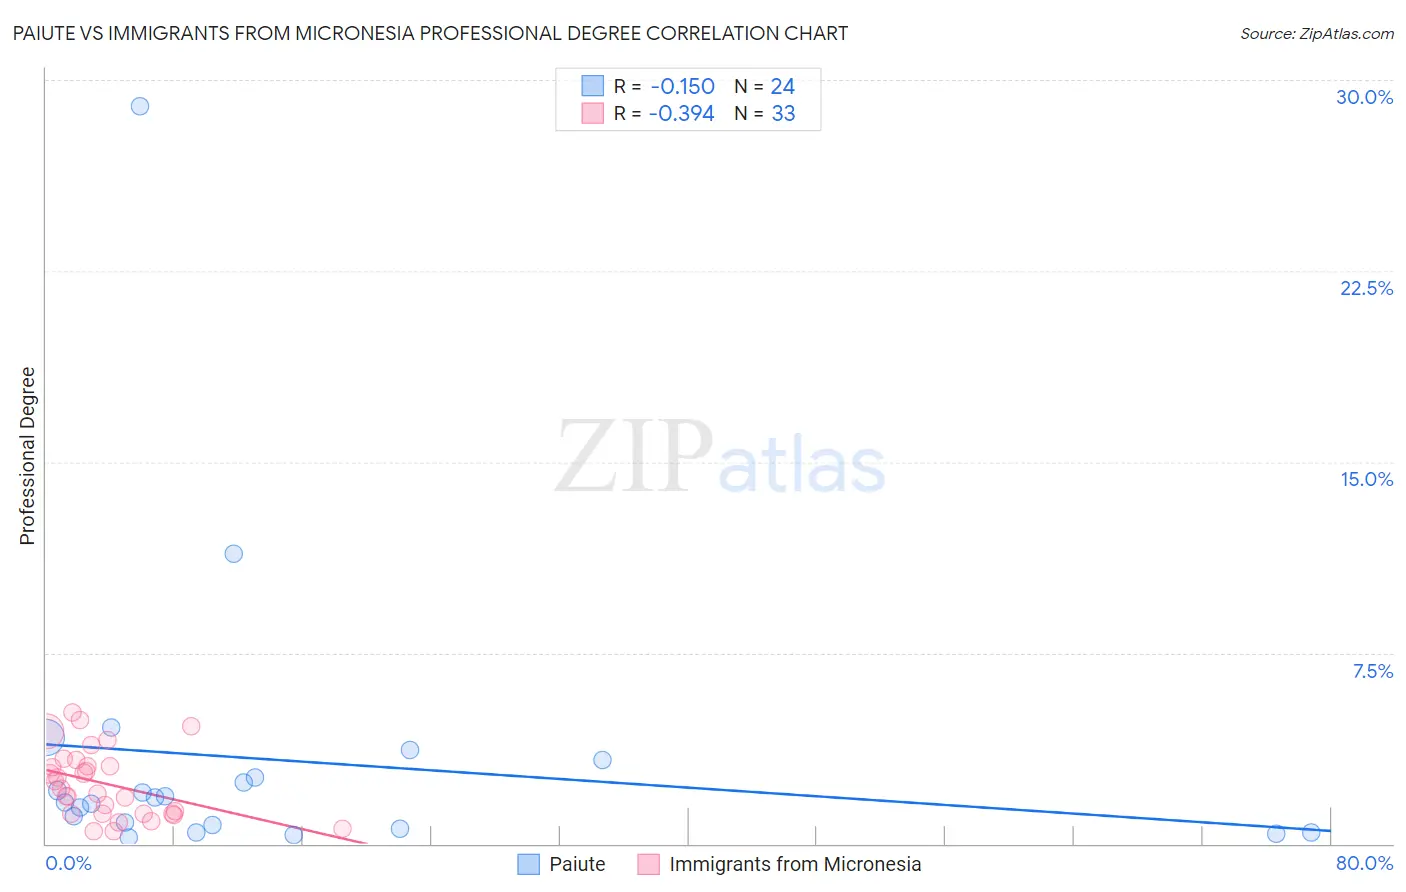
Paiute vs Immigrants from Micronesia Professional Degree Correlation Chart
The statistical analysis conducted on geographies consisting of 58,323,381 people shows a poor negative correlation between the proportion of Paiute and percentage of population with at least professional degree education in the United States with a correlation coefficient (R) of -0.150 and weighted average of 3.4%. Similarly, the statistical analysis conducted on geographies consisting of 61,532,393 people shows a mild negative correlation between the proportion of Immigrants from Micronesia and percentage of population with at least professional degree education in the United States with a correlation coefficient (R) of -0.394 and weighted average of 3.2%, a difference of 6.6%.
Professional Degree Correlation Summary
| Measurement | Paiute | Immigrants from Micronesia |
| Minimum | 0.27% | 0.49% |
| Maximum | 29.0% | 5.2% |
| Range | 28.7% | 4.7% |
| Mean | 3.3% | 2.4% |
| Median | 1.7% | 2.2% |
| Interquartile 25% (IQ1) | 0.65% | 1.2% |
| Interquartile 75% (IQ3) | 2.9% | 3.2% |
| Interquartile Range (IQR) | 2.3% | 2.0% |
| Standard Deviation (Sample) | 5.9% | 1.3% |
| Standard Deviation (Population) | 5.8% | 1.3% |
Similar Demographics by Professional Degree
Demographics Similar to Paiute by Professional Degree
In terms of professional degree, the demographic groups most similar to Paiute are Immigrants from Honduras (3.5%, a difference of 0.080%), Immigrants from Guatemala (3.4%, a difference of 0.16%), Hawaiian (3.4%, a difference of 0.16%), Immigrants from Belize (3.5%, a difference of 0.32%), and Alaska Native (3.5%, a difference of 0.39%).
| Demographics | Rating | Rank | Professional Degree |
| Immigrants | El Salvador | 0.3 /100 | #287 | Tragic 3.5% |
| Blackfeet | 0.3 /100 | #288 | Tragic 3.5% |
| Guatemalans | 0.3 /100 | #289 | Tragic 3.5% |
| Chippewa | 0.3 /100 | #290 | Tragic 3.5% |
| Alaska Natives | 0.3 /100 | #291 | Tragic 3.5% |
| Immigrants | Belize | 0.3 /100 | #292 | Tragic 3.5% |
| Immigrants | Honduras | 0.3 /100 | #293 | Tragic 3.5% |
| Paiute | 0.3 /100 | #294 | Tragic 3.4% |
| Immigrants | Guatemala | 0.2 /100 | #295 | Tragic 3.4% |
| Hawaiians | 0.2 /100 | #296 | Tragic 3.4% |
| Immigrants | Liberia | 0.2 /100 | #297 | Tragic 3.4% |
| Ottawa | 0.2 /100 | #298 | Tragic 3.4% |
| Immigrants | Yemen | 0.2 /100 | #299 | Tragic 3.4% |
| Blacks/African Americans | 0.2 /100 | #300 | Tragic 3.4% |
| Immigrants | Dominican Republic | 0.2 /100 | #301 | Tragic 3.4% |
Demographics Similar to Immigrants from Micronesia by Professional Degree
In terms of professional degree, the demographic groups most similar to Immigrants from Micronesia are Nepalese (3.2%, a difference of 0.030%), Puerto Rican (3.2%, a difference of 0.24%), Choctaw (3.2%, a difference of 0.24%), Immigrants from Laos (3.2%, a difference of 0.25%), and Mexican American Indian (3.3%, a difference of 0.93%).
| Demographics | Rating | Rank | Professional Degree |
| Cherokee | 0.1 /100 | #311 | Tragic 3.3% |
| Sioux | 0.1 /100 | #312 | Tragic 3.3% |
| Yuman | 0.1 /100 | #313 | Tragic 3.3% |
| Mexican American Indians | 0.1 /100 | #314 | Tragic 3.3% |
| Immigrants | Laos | 0.1 /100 | #315 | Tragic 3.2% |
| Puerto Ricans | 0.1 /100 | #316 | Tragic 3.2% |
| Nepalese | 0.1 /100 | #317 | Tragic 3.2% |
| Immigrants | Micronesia | 0.1 /100 | #318 | Tragic 3.2% |
| Choctaw | 0.1 /100 | #319 | Tragic 3.2% |
| Seminole | 0.1 /100 | #320 | Tragic 3.2% |
| Tsimshian | 0.0 /100 | #321 | Tragic 3.2% |
| Hispanics or Latinos | 0.0 /100 | #322 | Tragic 3.2% |
| Inupiat | 0.0 /100 | #323 | Tragic 3.2% |
| Crow | 0.0 /100 | #324 | Tragic 3.2% |
| Yaqui | 0.0 /100 | #325 | Tragic 3.2% |