Apache vs Immigrants from Micronesia Professional Degree
COMPARE
Apache
Immigrants from Micronesia
Professional Degree
Professional Degree Comparison
Apache
Immigrants from Micronesia
3.5%
PROFESSIONAL DEGREE
0.5/ 100
METRIC RATING
281st/ 347
METRIC RANK
3.2%
PROFESSIONAL DEGREE
0.1/ 100
METRIC RATING
318th/ 347
METRIC RANK
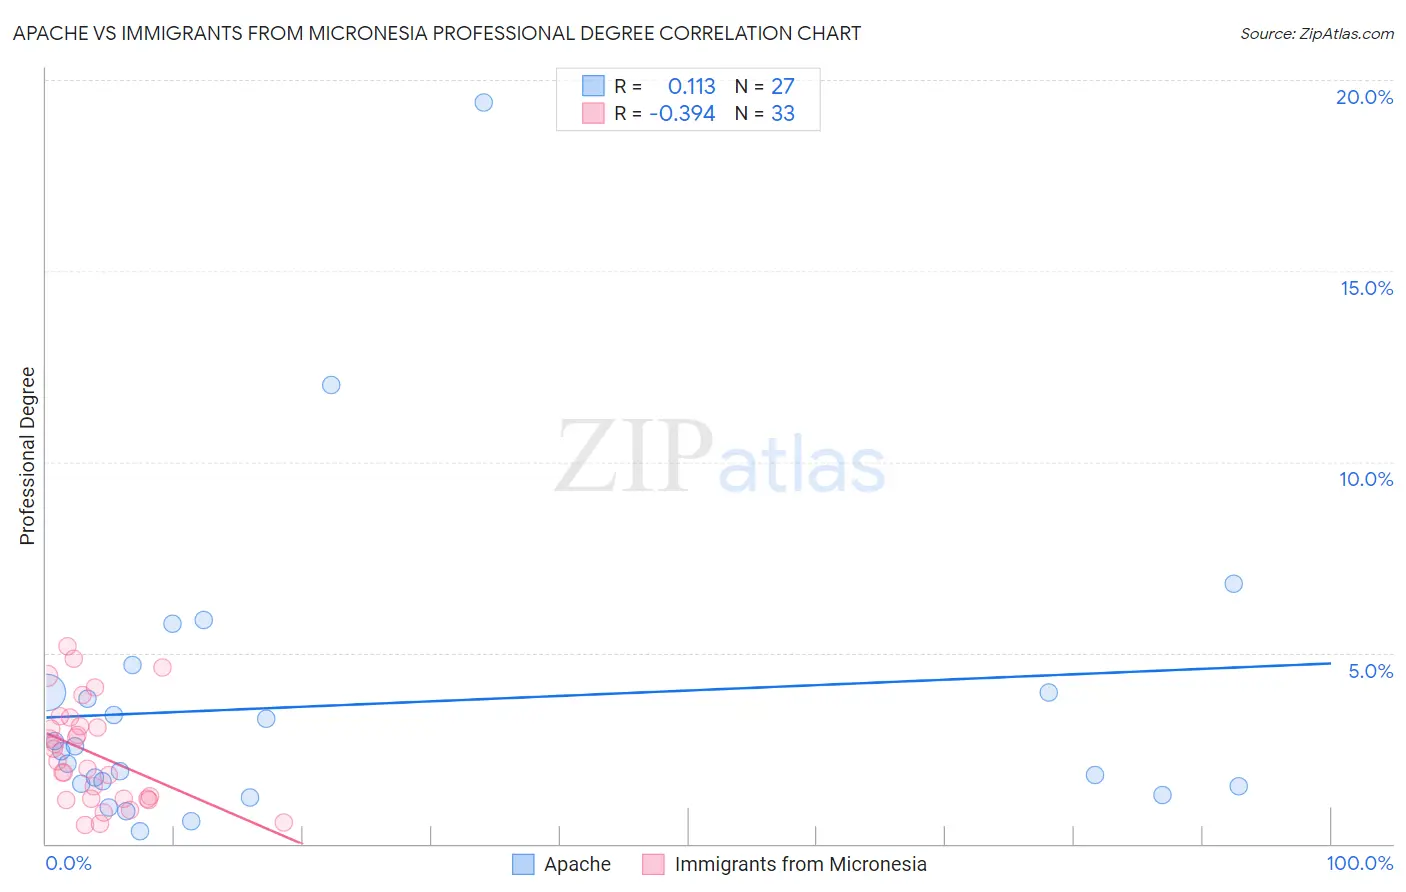
Apache vs Immigrants from Micronesia Professional Degree Correlation Chart
The statistical analysis conducted on geographies consisting of 230,302,236 people shows a poor positive correlation between the proportion of Apache and percentage of population with at least professional degree education in the United States with a correlation coefficient (R) of 0.113 and weighted average of 3.5%. Similarly, the statistical analysis conducted on geographies consisting of 61,532,393 people shows a mild negative correlation between the proportion of Immigrants from Micronesia and percentage of population with at least professional degree education in the United States with a correlation coefficient (R) of -0.394 and weighted average of 3.2%, a difference of 9.5%.
Professional Degree Correlation Summary
| Measurement | Apache | Immigrants from Micronesia |
| Minimum | 0.33% | 0.49% |
| Maximum | 19.4% | 5.2% |
| Range | 19.1% | 4.7% |
| Mean | 3.6% | 2.4% |
| Median | 2.4% | 2.2% |
| Interquartile 25% (IQ1) | 1.5% | 1.2% |
| Interquartile 75% (IQ3) | 4.0% | 3.2% |
| Interquartile Range (IQR) | 2.5% | 2.0% |
| Standard Deviation (Sample) | 4.0% | 1.3% |
| Standard Deviation (Population) | 3.9% | 1.3% |
Similar Demographics by Professional Degree
Demographics Similar to Apache by Professional Degree
In terms of professional degree, the demographic groups most similar to Apache are Immigrants from Caribbean (3.5%, a difference of 0.020%), Dominican (3.5%, a difference of 0.030%), Immigrants from Portugal (3.5%, a difference of 0.060%), Japanese (3.5%, a difference of 0.10%), and Cheyenne (3.6%, a difference of 0.16%).
| Demographics | Rating | Rank | Professional Degree |
| Potawatomi | 0.5 /100 | #274 | Tragic 3.6% |
| Immigrants | Dominica | 0.5 /100 | #275 | Tragic 3.6% |
| Liberians | 0.5 /100 | #276 | Tragic 3.6% |
| Cheyenne | 0.5 /100 | #277 | Tragic 3.6% |
| Japanese | 0.5 /100 | #278 | Tragic 3.5% |
| Immigrants | Portugal | 0.5 /100 | #279 | Tragic 3.5% |
| Dominicans | 0.5 /100 | #280 | Tragic 3.5% |
| Apache | 0.5 /100 | #281 | Tragic 3.5% |
| Immigrants | Caribbean | 0.5 /100 | #282 | Tragic 3.5% |
| Comanche | 0.4 /100 | #283 | Tragic 3.5% |
| Salvadorans | 0.4 /100 | #284 | Tragic 3.5% |
| Hondurans | 0.3 /100 | #285 | Tragic 3.5% |
| Haitians | 0.3 /100 | #286 | Tragic 3.5% |
| Immigrants | El Salvador | 0.3 /100 | #287 | Tragic 3.5% |
| Blackfeet | 0.3 /100 | #288 | Tragic 3.5% |
Demographics Similar to Immigrants from Micronesia by Professional Degree
In terms of professional degree, the demographic groups most similar to Immigrants from Micronesia are Nepalese (3.2%, a difference of 0.030%), Puerto Rican (3.2%, a difference of 0.24%), Choctaw (3.2%, a difference of 0.24%), Immigrants from Laos (3.2%, a difference of 0.25%), and Mexican American Indian (3.3%, a difference of 0.93%).
| Demographics | Rating | Rank | Professional Degree |
| Cherokee | 0.1 /100 | #311 | Tragic 3.3% |
| Sioux | 0.1 /100 | #312 | Tragic 3.3% |
| Yuman | 0.1 /100 | #313 | Tragic 3.3% |
| Mexican American Indians | 0.1 /100 | #314 | Tragic 3.3% |
| Immigrants | Laos | 0.1 /100 | #315 | Tragic 3.2% |
| Puerto Ricans | 0.1 /100 | #316 | Tragic 3.2% |
| Nepalese | 0.1 /100 | #317 | Tragic 3.2% |
| Immigrants | Micronesia | 0.1 /100 | #318 | Tragic 3.2% |
| Choctaw | 0.1 /100 | #319 | Tragic 3.2% |
| Seminole | 0.1 /100 | #320 | Tragic 3.2% |
| Tsimshian | 0.0 /100 | #321 | Tragic 3.2% |
| Hispanics or Latinos | 0.0 /100 | #322 | Tragic 3.2% |
| Inupiat | 0.0 /100 | #323 | Tragic 3.2% |
| Crow | 0.0 /100 | #324 | Tragic 3.2% |
| Yaqui | 0.0 /100 | #325 | Tragic 3.2% |