Paiute vs Immigrants from St. Vincent and the Grenadines Professional Degree
COMPARE
Paiute
Immigrants from St. Vincent and the Grenadines
Professional Degree
Professional Degree Comparison
Paiute
Immigrants from St. Vincent and the Grenadines
3.4%
PROFESSIONAL DEGREE
0.3/ 100
METRIC RATING
294th/ 347
METRIC RANK
3.7%
PROFESSIONAL DEGREE
1.1/ 100
METRIC RATING
258th/ 347
METRIC RANK
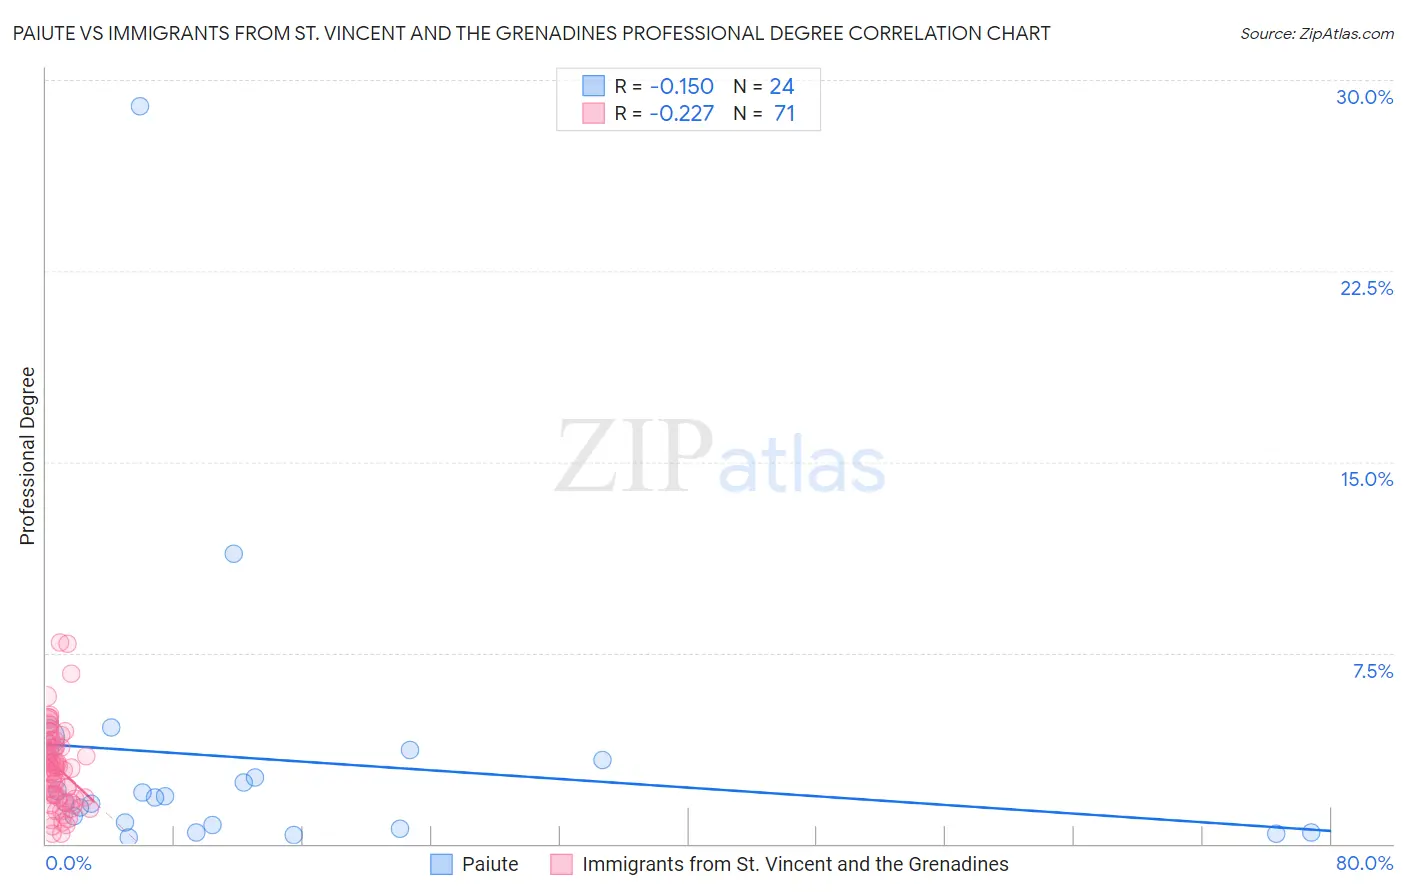
Paiute vs Immigrants from St. Vincent and the Grenadines Professional Degree Correlation Chart
The statistical analysis conducted on geographies consisting of 58,323,381 people shows a poor negative correlation between the proportion of Paiute and percentage of population with at least professional degree education in the United States with a correlation coefficient (R) of -0.150 and weighted average of 3.4%. Similarly, the statistical analysis conducted on geographies consisting of 56,174,438 people shows a weak negative correlation between the proportion of Immigrants from St. Vincent and the Grenadines and percentage of population with at least professional degree education in the United States with a correlation coefficient (R) of -0.227 and weighted average of 3.7%, a difference of 6.7%.
Professional Degree Correlation Summary
| Measurement | Paiute | Immigrants from St. Vincent and the Grenadines |
| Minimum | 0.27% | 0.38% |
| Maximum | 29.0% | 7.9% |
| Range | 28.7% | 7.6% |
| Mean | 3.3% | 3.0% |
| Median | 1.7% | 3.0% |
| Interquartile 25% (IQ1) | 0.65% | 1.8% |
| Interquartile 75% (IQ3) | 2.9% | 4.0% |
| Interquartile Range (IQR) | 2.3% | 2.2% |
| Standard Deviation (Sample) | 5.9% | 1.6% |
| Standard Deviation (Population) | 5.8% | 1.6% |
Similar Demographics by Professional Degree
Demographics Similar to Paiute by Professional Degree
In terms of professional degree, the demographic groups most similar to Paiute are Immigrants from Honduras (3.5%, a difference of 0.080%), Immigrants from Guatemala (3.4%, a difference of 0.16%), Hawaiian (3.4%, a difference of 0.16%), Immigrants from Belize (3.5%, a difference of 0.32%), and Alaska Native (3.5%, a difference of 0.39%).
| Demographics | Rating | Rank | Professional Degree |
| Immigrants | El Salvador | 0.3 /100 | #287 | Tragic 3.5% |
| Blackfeet | 0.3 /100 | #288 | Tragic 3.5% |
| Guatemalans | 0.3 /100 | #289 | Tragic 3.5% |
| Chippewa | 0.3 /100 | #290 | Tragic 3.5% |
| Alaska Natives | 0.3 /100 | #291 | Tragic 3.5% |
| Immigrants | Belize | 0.3 /100 | #292 | Tragic 3.5% |
| Immigrants | Honduras | 0.3 /100 | #293 | Tragic 3.5% |
| Paiute | 0.3 /100 | #294 | Tragic 3.4% |
| Immigrants | Guatemala | 0.2 /100 | #295 | Tragic 3.4% |
| Hawaiians | 0.2 /100 | #296 | Tragic 3.4% |
| Immigrants | Liberia | 0.2 /100 | #297 | Tragic 3.4% |
| Ottawa | 0.2 /100 | #298 | Tragic 3.4% |
| Immigrants | Yemen | 0.2 /100 | #299 | Tragic 3.4% |
| Blacks/African Americans | 0.2 /100 | #300 | Tragic 3.4% |
| Immigrants | Dominican Republic | 0.2 /100 | #301 | Tragic 3.4% |
Demographics Similar to Immigrants from St. Vincent and the Grenadines by Professional Degree
In terms of professional degree, the demographic groups most similar to Immigrants from St. Vincent and the Grenadines are Bahamian (3.7%, a difference of 0.080%), African (3.7%, a difference of 0.22%), Indonesian (3.7%, a difference of 0.23%), Immigrants from Guyana (3.7%, a difference of 0.41%), and U.S. Virgin Islander (3.7%, a difference of 0.42%).
| Demographics | Rating | Rank | Professional Degree |
| Immigrants | Nicaragua | 1.4 /100 | #251 | Tragic 3.7% |
| Jamaicans | 1.4 /100 | #252 | Tragic 3.7% |
| Pueblo | 1.4 /100 | #253 | Tragic 3.7% |
| Tongans | 1.3 /100 | #254 | Tragic 3.7% |
| Osage | 1.2 /100 | #255 | Tragic 3.7% |
| Iroquois | 1.2 /100 | #256 | Tragic 3.7% |
| Bahamians | 1.1 /100 | #257 | Tragic 3.7% |
| Immigrants | St. Vincent and the Grenadines | 1.1 /100 | #258 | Tragic 3.7% |
| Africans | 1.0 /100 | #259 | Tragic 3.7% |
| Indonesians | 1.0 /100 | #260 | Tragic 3.7% |
| Immigrants | Guyana | 1.0 /100 | #261 | Tragic 3.7% |
| U.S. Virgin Islanders | 1.0 /100 | #262 | Tragic 3.7% |
| Hopi | 0.9 /100 | #263 | Tragic 3.6% |
| Immigrants | Cambodia | 0.9 /100 | #264 | Tragic 3.6% |
| Immigrants | Congo | 0.8 /100 | #265 | Tragic 3.6% |