Paiute vs Immigrants from Micronesia 1st Grade
COMPARE
Paiute
Immigrants from Micronesia
1st Grade
1st Grade Comparison
Paiute
Immigrants from Micronesia
97.9%
1ST GRADE
36.5/ 100
METRIC RATING
186th/ 347
METRIC RANK
97.9%
1ST GRADE
55.3/ 100
METRIC RATING
169th/ 347
METRIC RANK
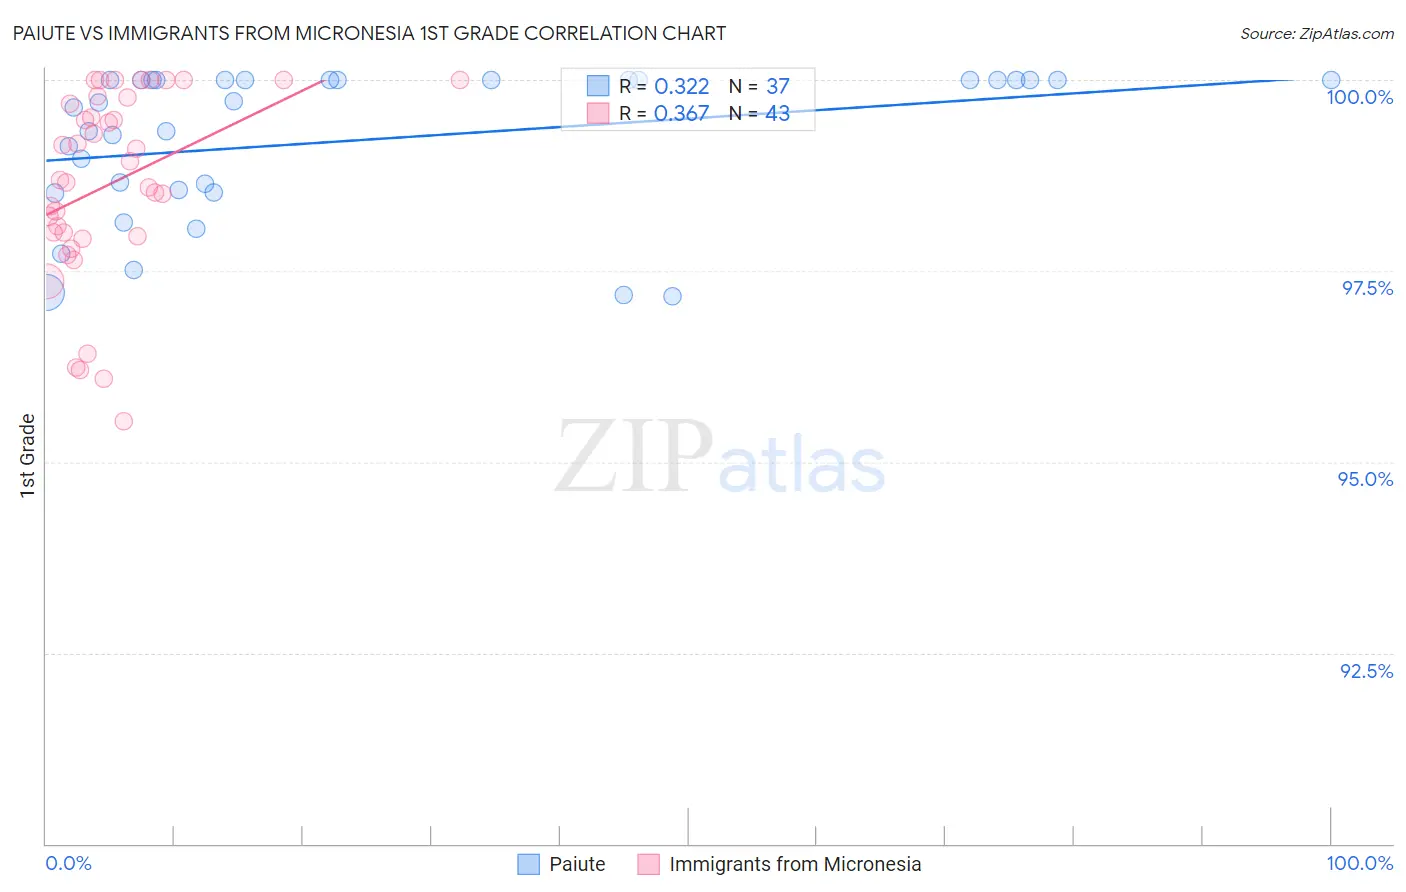
Paiute vs Immigrants from Micronesia 1st Grade Correlation Chart
The statistical analysis conducted on geographies consisting of 58,402,332 people shows a mild positive correlation between the proportion of Paiute and percentage of population with at least 1st grade education in the United States with a correlation coefficient (R) of 0.322 and weighted average of 97.9%. Similarly, the statistical analysis conducted on geographies consisting of 61,604,657 people shows a mild positive correlation between the proportion of Immigrants from Micronesia and percentage of population with at least 1st grade education in the United States with a correlation coefficient (R) of 0.367 and weighted average of 97.9%, a difference of 0.060%.
1st Grade Correlation Summary
| Measurement | Paiute | Immigrants from Micronesia |
| Minimum | 97.2% | 95.5% |
| Maximum | 100.0% | 100.0% |
| Range | 2.8% | 4.5% |
| Mean | 99.2% | 98.6% |
| Median | 99.7% | 98.7% |
| Interquartile 25% (IQ1) | 98.5% | 98.0% |
| Interquartile 75% (IQ3) | 100.0% | 99.8% |
| Interquartile Range (IQR) | 1.5% | 1.8% |
| Standard Deviation (Sample) | 0.96% | 1.2% |
| Standard Deviation (Population) | 0.95% | 1.2% |
Demographics Similar to Paiute and Immigrants from Micronesia by 1st Grade
In terms of 1st grade, the demographic groups most similar to Paiute are Pakistani (97.9%, a difference of 0.0%), Immigrants from Poland (97.9%, a difference of 0.010%), Immigrants from Belarus (97.9%, a difference of 0.010%), Portuguese (97.9%, a difference of 0.020%), and Egyptian (97.9%, a difference of 0.020%). Similarly, the demographic groups most similar to Immigrants from Micronesia are Bermudan (97.9%, a difference of 0.0%), Chilean (97.9%, a difference of 0.0%), Immigrants from Spain (97.9%, a difference of 0.0%), Immigrants from Jordan (97.9%, a difference of 0.0%), and Immigrants from Korea (97.9%, a difference of 0.010%).
| Demographics | Rating | Rank | 1st Grade |
| Bermudans | 56.3 /100 | #167 | Average 97.9% |
| Chileans | 55.6 /100 | #168 | Average 97.9% |
| Immigrants | Micronesia | 55.3 /100 | #169 | Average 97.9% |
| Immigrants | Spain | 54.9 /100 | #170 | Average 97.9% |
| Immigrants | Jordan | 53.9 /100 | #171 | Average 97.9% |
| Immigrants | Korea | 53.0 /100 | #172 | Average 97.9% |
| Kenyans | 51.2 /100 | #173 | Average 97.9% |
| Natives/Alaskans | 50.0 /100 | #174 | Average 97.9% |
| Immigrants | Sri Lanka | 49.7 /100 | #175 | Average 97.9% |
| Albanians | 49.6 /100 | #176 | Average 97.9% |
| Immigrants | Brazil | 49.1 /100 | #177 | Average 97.9% |
| Immigrants | Venezuela | 47.8 /100 | #178 | Average 97.9% |
| Argentineans | 47.2 /100 | #179 | Average 97.9% |
| Immigrants | Bosnia and Herzegovina | 46.6 /100 | #180 | Average 97.9% |
| Portuguese | 44.2 /100 | #181 | Average 97.9% |
| Egyptians | 42.7 /100 | #182 | Average 97.9% |
| Immigrants | Argentina | 41.3 /100 | #183 | Average 97.9% |
| Immigrants | Poland | 40.1 /100 | #184 | Average 97.9% |
| Immigrants | Belarus | 39.3 /100 | #185 | Fair 97.9% |
| Paiute | 36.5 /100 | #186 | Fair 97.9% |
| Pakistanis | 35.8 /100 | #187 | Fair 97.9% |