German vs Immigrants from Micronesia Professional Degree
COMPARE
German
Immigrants from Micronesia
Professional Degree
Professional Degree Comparison
Germans
Immigrants from Micronesia
4.1%
PROFESSIONAL DEGREE
11.6/ 100
METRIC RATING
211th/ 347
METRIC RANK
3.2%
PROFESSIONAL DEGREE
0.1/ 100
METRIC RATING
318th/ 347
METRIC RANK
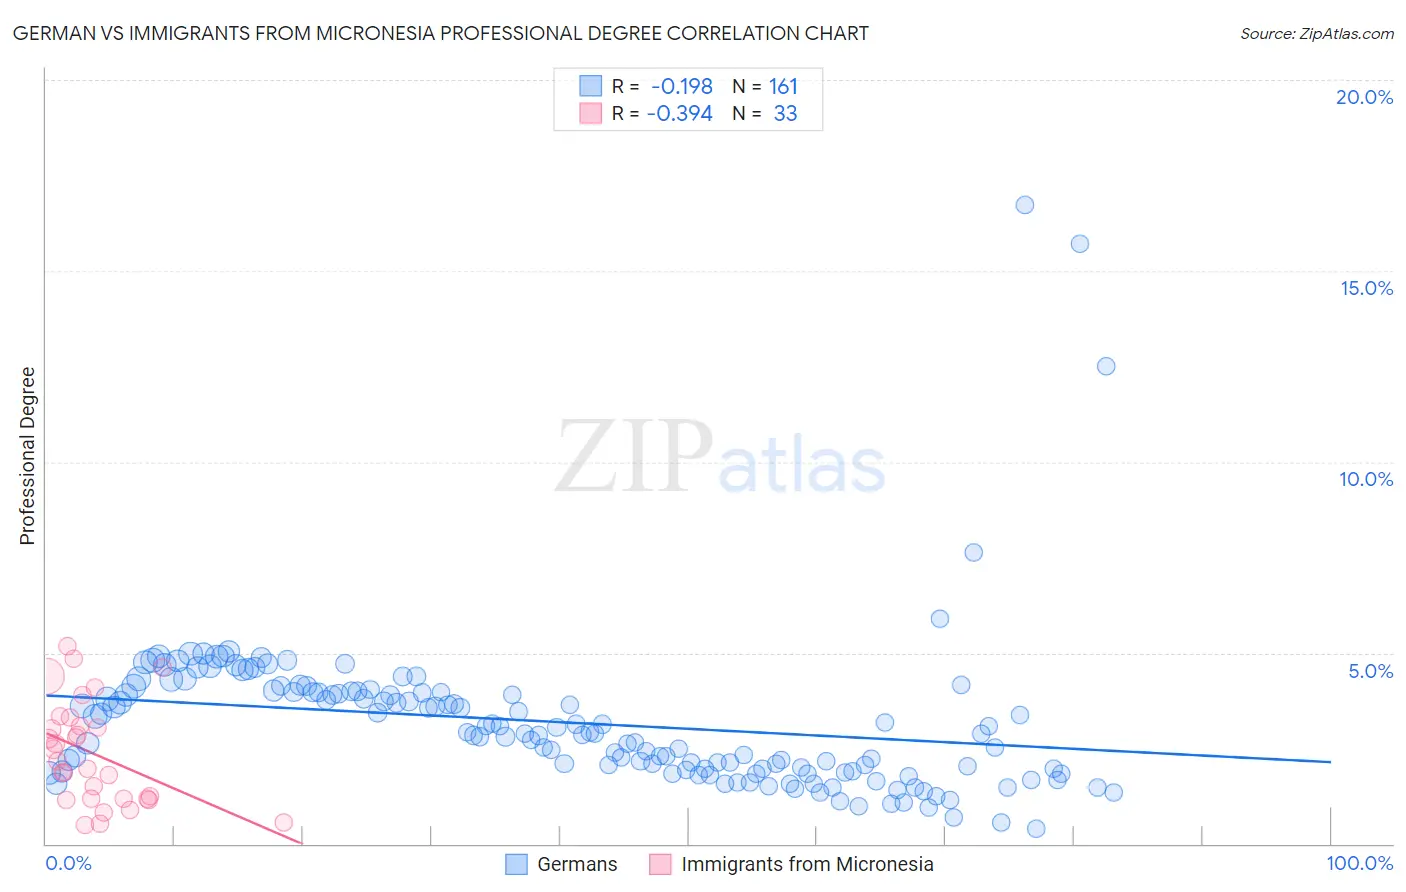
German vs Immigrants from Micronesia Professional Degree Correlation Chart
The statistical analysis conducted on geographies consisting of 569,766,622 people shows a poor negative correlation between the proportion of Germans and percentage of population with at least professional degree education in the United States with a correlation coefficient (R) of -0.198 and weighted average of 4.1%. Similarly, the statistical analysis conducted on geographies consisting of 61,532,393 people shows a mild negative correlation between the proportion of Immigrants from Micronesia and percentage of population with at least professional degree education in the United States with a correlation coefficient (R) of -0.394 and weighted average of 3.2%, a difference of 26.1%.
Professional Degree Correlation Summary
| Measurement | German | Immigrants from Micronesia |
| Minimum | 0.41% | 0.49% |
| Maximum | 16.7% | 5.2% |
| Range | 16.3% | 4.7% |
| Mean | 3.2% | 2.4% |
| Median | 2.9% | 2.2% |
| Interquartile 25% (IQ1) | 1.9% | 1.2% |
| Interquartile 75% (IQ3) | 4.0% | 3.2% |
| Interquartile Range (IQR) | 2.1% | 2.0% |
| Standard Deviation (Sample) | 2.1% | 1.3% |
| Standard Deviation (Population) | 2.1% | 1.3% |
Similar Demographics by Professional Degree
Demographics Similar to Germans by Professional Degree
In terms of professional degree, the demographic groups most similar to Germans are Immigrants from Nigeria (4.1%, a difference of 0.030%), White/Caucasian (4.1%, a difference of 0.18%), Immigrants from Panama (4.1%, a difference of 0.26%), Immigrants from Somalia (4.1%, a difference of 0.33%), and Korean (4.1%, a difference of 0.36%).
| Demographics | Rating | Rank | Professional Degree |
| Barbadians | 15.8 /100 | #204 | Poor 4.1% |
| Somalis | 14.8 /100 | #205 | Poor 4.1% |
| Yugoslavians | 13.4 /100 | #206 | Poor 4.1% |
| Sub-Saharan Africans | 12.8 /100 | #207 | Poor 4.1% |
| Immigrants | Somalia | 12.5 /100 | #208 | Poor 4.1% |
| Immigrants | Panama | 12.3 /100 | #209 | Poor 4.1% |
| Immigrants | Nigeria | 11.7 /100 | #210 | Poor 4.1% |
| Germans | 11.6 /100 | #211 | Poor 4.1% |
| Whites/Caucasians | 11.2 /100 | #212 | Poor 4.1% |
| Koreans | 10.7 /100 | #213 | Poor 4.1% |
| Immigrants | Ghana | 10.6 /100 | #214 | Poor 4.1% |
| Portuguese | 10.5 /100 | #215 | Poor 4.1% |
| West Indians | 9.8 /100 | #216 | Tragic 4.1% |
| Immigrants | Vietnam | 9.4 /100 | #217 | Tragic 4.0% |
| Dutch | 9.0 /100 | #218 | Tragic 4.0% |
Demographics Similar to Immigrants from Micronesia by Professional Degree
In terms of professional degree, the demographic groups most similar to Immigrants from Micronesia are Nepalese (3.2%, a difference of 0.030%), Puerto Rican (3.2%, a difference of 0.24%), Choctaw (3.2%, a difference of 0.24%), Immigrants from Laos (3.2%, a difference of 0.25%), and Mexican American Indian (3.3%, a difference of 0.93%).
| Demographics | Rating | Rank | Professional Degree |
| Cherokee | 0.1 /100 | #311 | Tragic 3.3% |
| Sioux | 0.1 /100 | #312 | Tragic 3.3% |
| Yuman | 0.1 /100 | #313 | Tragic 3.3% |
| Mexican American Indians | 0.1 /100 | #314 | Tragic 3.3% |
| Immigrants | Laos | 0.1 /100 | #315 | Tragic 3.2% |
| Puerto Ricans | 0.1 /100 | #316 | Tragic 3.2% |
| Nepalese | 0.1 /100 | #317 | Tragic 3.2% |
| Immigrants | Micronesia | 0.1 /100 | #318 | Tragic 3.2% |
| Choctaw | 0.1 /100 | #319 | Tragic 3.2% |
| Seminole | 0.1 /100 | #320 | Tragic 3.2% |
| Tsimshian | 0.0 /100 | #321 | Tragic 3.2% |
| Hispanics or Latinos | 0.0 /100 | #322 | Tragic 3.2% |
| Inupiat | 0.0 /100 | #323 | Tragic 3.2% |
| Crow | 0.0 /100 | #324 | Tragic 3.2% |
| Yaqui | 0.0 /100 | #325 | Tragic 3.2% |