Guamanian/Chamorro vs Immigrants from Micronesia Professional Degree
COMPARE
Guamanian/Chamorro
Immigrants from Micronesia
Professional Degree
Professional Degree Comparison
Guamanians/Chamorros
Immigrants from Micronesia
3.8%
PROFESSIONAL DEGREE
2.2/ 100
METRIC RATING
243rd/ 347
METRIC RANK
3.2%
PROFESSIONAL DEGREE
0.1/ 100
METRIC RATING
318th/ 347
METRIC RANK
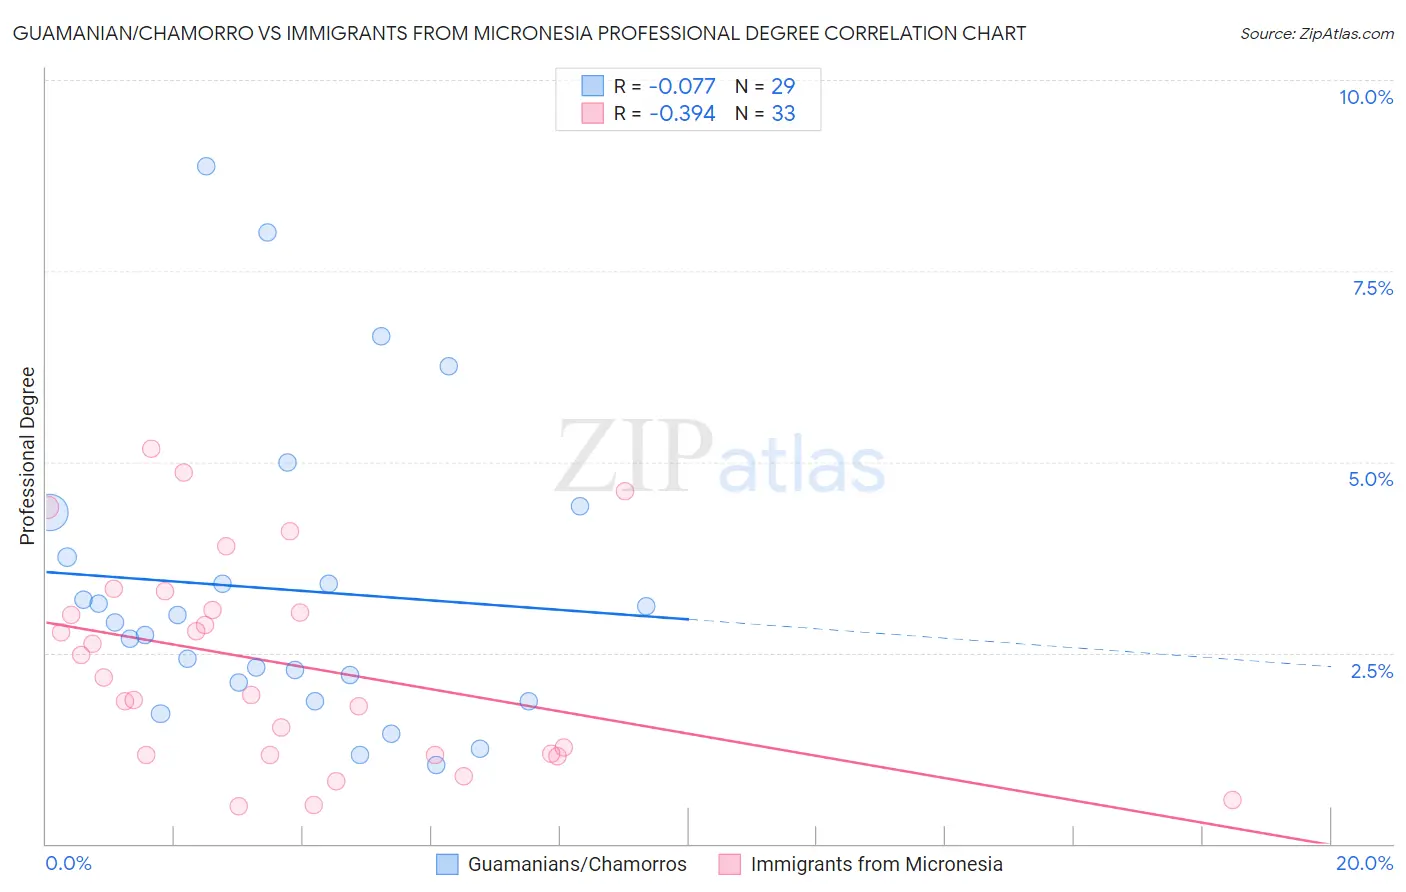
Guamanian/Chamorro vs Immigrants from Micronesia Professional Degree Correlation Chart
The statistical analysis conducted on geographies consisting of 221,637,971 people shows a slight negative correlation between the proportion of Guamanians/Chamorros and percentage of population with at least professional degree education in the United States with a correlation coefficient (R) of -0.077 and weighted average of 3.8%. Similarly, the statistical analysis conducted on geographies consisting of 61,532,393 people shows a mild negative correlation between the proportion of Immigrants from Micronesia and percentage of population with at least professional degree education in the United States with a correlation coefficient (R) of -0.394 and weighted average of 3.2%, a difference of 17.4%.
Professional Degree Correlation Summary
| Measurement | Guamanian/Chamorro | Immigrants from Micronesia |
| Minimum | 1.0% | 0.49% |
| Maximum | 8.9% | 5.2% |
| Range | 7.8% | 4.7% |
| Mean | 3.3% | 2.4% |
| Median | 2.9% | 2.2% |
| Interquartile 25% (IQ1) | 2.0% | 1.2% |
| Interquartile 75% (IQ3) | 4.0% | 3.2% |
| Interquartile Range (IQR) | 2.1% | 2.0% |
| Standard Deviation (Sample) | 2.0% | 1.3% |
| Standard Deviation (Population) | 1.9% | 1.3% |
Similar Demographics by Professional Degree
Demographics Similar to Guamanians/Chamorros by Professional Degree
In terms of professional degree, the demographic groups most similar to Guamanians/Chamorros are Alaskan Athabascan (3.8%, a difference of 0.080%), Native Hawaiian (3.8%, a difference of 0.080%), Immigrants from Ecuador (3.8%, a difference of 0.10%), British West Indian (3.8%, a difference of 0.33%), and Immigrants from Bahamas (3.8%, a difference of 0.43%).
| Demographics | Rating | Rank | Professional Degree |
| Spanish Americans | 3.8 /100 | #236 | Tragic 3.9% |
| Immigrants | Trinidad and Tobago | 3.8 /100 | #237 | Tragic 3.9% |
| Colville | 2.6 /100 | #238 | Tragic 3.8% |
| British West Indians | 2.4 /100 | #239 | Tragic 3.8% |
| Immigrants | Ecuador | 2.3 /100 | #240 | Tragic 3.8% |
| Alaskan Athabascans | 2.3 /100 | #241 | Tragic 3.8% |
| Native Hawaiians | 2.3 /100 | #242 | Tragic 3.8% |
| Guamanians/Chamorros | 2.2 /100 | #243 | Tragic 3.8% |
| Immigrants | Bahamas | 2.0 /100 | #244 | Tragic 3.8% |
| French American Indians | 1.7 /100 | #245 | Tragic 3.8% |
| Marshallese | 1.7 /100 | #246 | Tragic 3.8% |
| Guyanese | 1.6 /100 | #247 | Tragic 3.8% |
| Hmong | 1.6 /100 | #248 | Tragic 3.7% |
| Immigrants | Grenada | 1.5 /100 | #249 | Tragic 3.7% |
| Immigrants | Fiji | 1.5 /100 | #250 | Tragic 3.7% |
Demographics Similar to Immigrants from Micronesia by Professional Degree
In terms of professional degree, the demographic groups most similar to Immigrants from Micronesia are Nepalese (3.2%, a difference of 0.030%), Puerto Rican (3.2%, a difference of 0.24%), Choctaw (3.2%, a difference of 0.24%), Immigrants from Laos (3.2%, a difference of 0.25%), and Mexican American Indian (3.3%, a difference of 0.93%).
| Demographics | Rating | Rank | Professional Degree |
| Cherokee | 0.1 /100 | #311 | Tragic 3.3% |
| Sioux | 0.1 /100 | #312 | Tragic 3.3% |
| Yuman | 0.1 /100 | #313 | Tragic 3.3% |
| Mexican American Indians | 0.1 /100 | #314 | Tragic 3.3% |
| Immigrants | Laos | 0.1 /100 | #315 | Tragic 3.2% |
| Puerto Ricans | 0.1 /100 | #316 | Tragic 3.2% |
| Nepalese | 0.1 /100 | #317 | Tragic 3.2% |
| Immigrants | Micronesia | 0.1 /100 | #318 | Tragic 3.2% |
| Choctaw | 0.1 /100 | #319 | Tragic 3.2% |
| Seminole | 0.1 /100 | #320 | Tragic 3.2% |
| Tsimshian | 0.0 /100 | #321 | Tragic 3.2% |
| Hispanics or Latinos | 0.0 /100 | #322 | Tragic 3.2% |
| Inupiat | 0.0 /100 | #323 | Tragic 3.2% |
| Crow | 0.0 /100 | #324 | Tragic 3.2% |
| Yaqui | 0.0 /100 | #325 | Tragic 3.2% |