Paiute vs Potawatomi Professional Degree
COMPARE
Paiute
Potawatomi
Professional Degree
Professional Degree Comparison
Paiute
Potawatomi
3.4%
PROFESSIONAL DEGREE
0.3/ 100
METRIC RATING
294th/ 347
METRIC RANK
3.6%
PROFESSIONAL DEGREE
0.5/ 100
METRIC RATING
274th/ 347
METRIC RANK
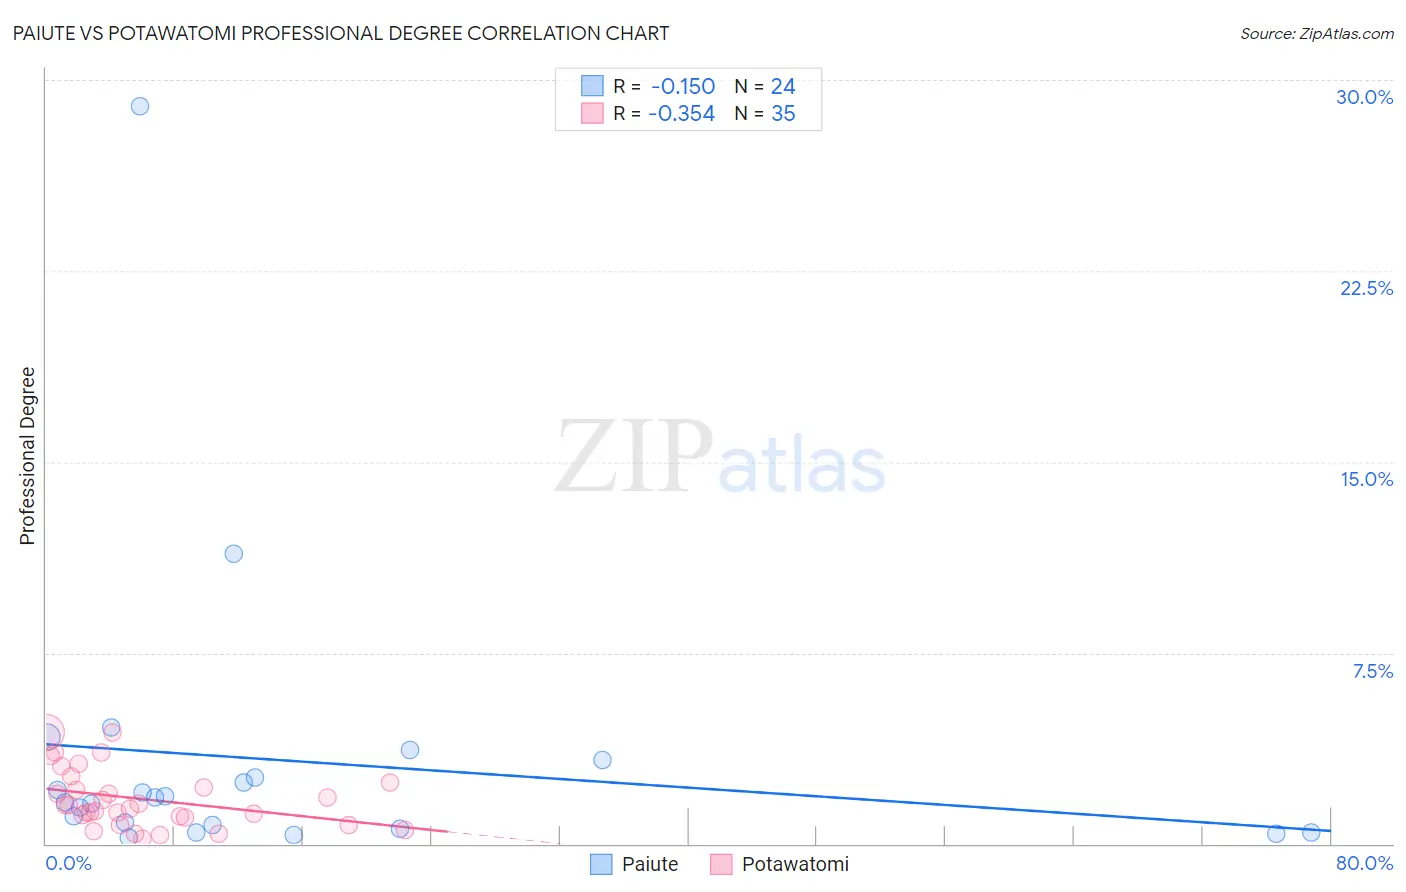
Paiute vs Potawatomi Professional Degree Correlation Chart
The statistical analysis conducted on geographies consisting of 58,323,381 people shows a poor negative correlation between the proportion of Paiute and percentage of population with at least professional degree education in the United States with a correlation coefficient (R) of -0.150 and weighted average of 3.4%. Similarly, the statistical analysis conducted on geographies consisting of 117,535,348 people shows a mild negative correlation between the proportion of Potawatomi and percentage of population with at least professional degree education in the United States with a correlation coefficient (R) of -0.354 and weighted average of 3.6%, a difference of 3.2%.
Professional Degree Correlation Summary
| Measurement | Paiute | Potawatomi |
| Minimum | 0.27% | 0.21% |
| Maximum | 29.0% | 4.4% |
| Range | 28.7% | 4.2% |
| Mean | 3.3% | 1.8% |
| Median | 1.7% | 1.5% |
| Interquartile 25% (IQ1) | 0.65% | 1.0% |
| Interquartile 75% (IQ3) | 2.9% | 2.4% |
| Interquartile Range (IQR) | 2.3% | 1.4% |
| Standard Deviation (Sample) | 5.9% | 1.1% |
| Standard Deviation (Population) | 5.8% | 1.1% |
Demographics Similar to Paiute and Potawatomi by Professional Degree
In terms of professional degree, the demographic groups most similar to Paiute are Immigrants from Honduras (3.5%, a difference of 0.080%), Immigrants from Belize (3.5%, a difference of 0.32%), Alaska Native (3.5%, a difference of 0.39%), Chippewa (3.5%, a difference of 0.56%), and Guatemalan (3.5%, a difference of 0.57%). Similarly, the demographic groups most similar to Potawatomi are Immigrants from Dominica (3.6%, a difference of 0.23%), Liberian (3.6%, a difference of 0.27%), Cheyenne (3.6%, a difference of 0.29%), Japanese (3.5%, a difference of 0.35%), and Immigrants from Portugal (3.5%, a difference of 0.39%).
| Demographics | Rating | Rank | Professional Degree |
| Potawatomi | 0.5 /100 | #274 | Tragic 3.6% |
| Immigrants | Dominica | 0.5 /100 | #275 | Tragic 3.6% |
| Liberians | 0.5 /100 | #276 | Tragic 3.6% |
| Cheyenne | 0.5 /100 | #277 | Tragic 3.6% |
| Japanese | 0.5 /100 | #278 | Tragic 3.5% |
| Immigrants | Portugal | 0.5 /100 | #279 | Tragic 3.5% |
| Dominicans | 0.5 /100 | #280 | Tragic 3.5% |
| Apache | 0.5 /100 | #281 | Tragic 3.5% |
| Immigrants | Caribbean | 0.5 /100 | #282 | Tragic 3.5% |
| Comanche | 0.4 /100 | #283 | Tragic 3.5% |
| Salvadorans | 0.4 /100 | #284 | Tragic 3.5% |
| Hondurans | 0.3 /100 | #285 | Tragic 3.5% |
| Haitians | 0.3 /100 | #286 | Tragic 3.5% |
| Immigrants | El Salvador | 0.3 /100 | #287 | Tragic 3.5% |
| Blackfeet | 0.3 /100 | #288 | Tragic 3.5% |
| Guatemalans | 0.3 /100 | #289 | Tragic 3.5% |
| Chippewa | 0.3 /100 | #290 | Tragic 3.5% |
| Alaska Natives | 0.3 /100 | #291 | Tragic 3.5% |
| Immigrants | Belize | 0.3 /100 | #292 | Tragic 3.5% |
| Immigrants | Honduras | 0.3 /100 | #293 | Tragic 3.5% |
| Paiute | 0.3 /100 | #294 | Tragic 3.4% |