Paiute vs Immigrants from Canada Professional Degree
COMPARE
Paiute
Immigrants from Canada
Professional Degree
Professional Degree Comparison
Paiute
Immigrants from Canada
3.4%
PROFESSIONAL DEGREE
0.3/ 100
METRIC RATING
294th/ 347
METRIC RANK
5.3%
PROFESSIONAL DEGREE
99.7/ 100
METRIC RATING
76th/ 347
METRIC RANK
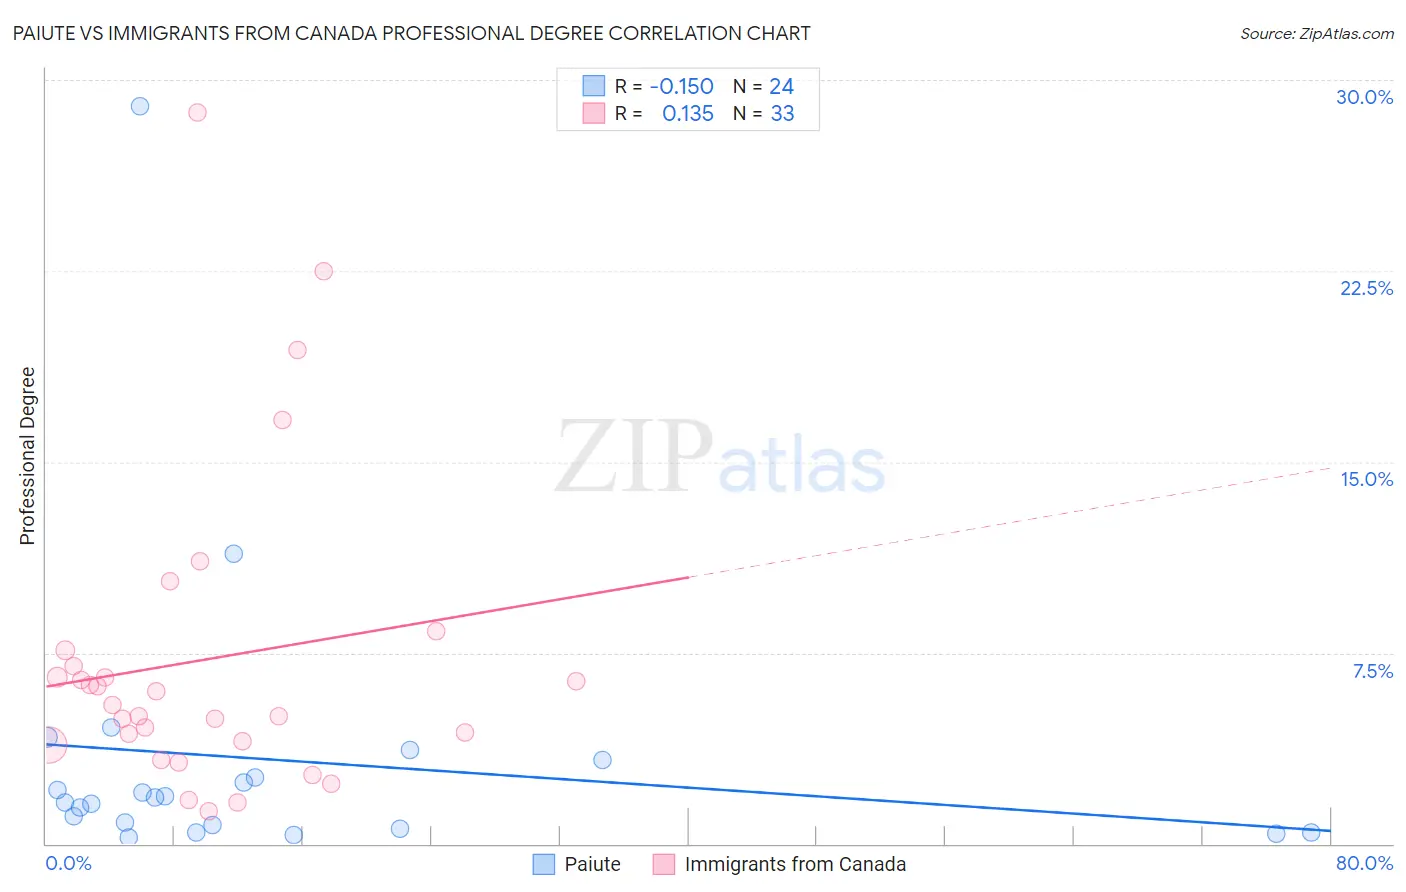
Paiute vs Immigrants from Canada Professional Degree Correlation Chart
The statistical analysis conducted on geographies consisting of 58,323,381 people shows a poor negative correlation between the proportion of Paiute and percentage of population with at least professional degree education in the United States with a correlation coefficient (R) of -0.150 and weighted average of 3.4%. Similarly, the statistical analysis conducted on geographies consisting of 457,915,451 people shows a poor positive correlation between the proportion of Immigrants from Canada and percentage of population with at least professional degree education in the United States with a correlation coefficient (R) of 0.135 and weighted average of 5.3%, a difference of 55.0%.
Professional Degree Correlation Summary
| Measurement | Paiute | Immigrants from Canada |
| Minimum | 0.27% | 1.3% |
| Maximum | 29.0% | 28.7% |
| Range | 28.7% | 27.4% |
| Mean | 3.3% | 7.2% |
| Median | 1.7% | 5.5% |
| Interquartile 25% (IQ1) | 0.65% | 4.0% |
| Interquartile 75% (IQ3) | 2.9% | 7.3% |
| Interquartile Range (IQR) | 2.3% | 3.3% |
| Standard Deviation (Sample) | 5.9% | 6.1% |
| Standard Deviation (Population) | 5.8% | 6.0% |
Similar Demographics by Professional Degree
Demographics Similar to Paiute by Professional Degree
In terms of professional degree, the demographic groups most similar to Paiute are Immigrants from Honduras (3.5%, a difference of 0.080%), Immigrants from Guatemala (3.4%, a difference of 0.16%), Hawaiian (3.4%, a difference of 0.16%), Immigrants from Belize (3.5%, a difference of 0.32%), and Alaska Native (3.5%, a difference of 0.39%).
| Demographics | Rating | Rank | Professional Degree |
| Immigrants | El Salvador | 0.3 /100 | #287 | Tragic 3.5% |
| Blackfeet | 0.3 /100 | #288 | Tragic 3.5% |
| Guatemalans | 0.3 /100 | #289 | Tragic 3.5% |
| Chippewa | 0.3 /100 | #290 | Tragic 3.5% |
| Alaska Natives | 0.3 /100 | #291 | Tragic 3.5% |
| Immigrants | Belize | 0.3 /100 | #292 | Tragic 3.5% |
| Immigrants | Honduras | 0.3 /100 | #293 | Tragic 3.5% |
| Paiute | 0.3 /100 | #294 | Tragic 3.4% |
| Immigrants | Guatemala | 0.2 /100 | #295 | Tragic 3.4% |
| Hawaiians | 0.2 /100 | #296 | Tragic 3.4% |
| Immigrants | Liberia | 0.2 /100 | #297 | Tragic 3.4% |
| Ottawa | 0.2 /100 | #298 | Tragic 3.4% |
| Immigrants | Yemen | 0.2 /100 | #299 | Tragic 3.4% |
| Blacks/African Americans | 0.2 /100 | #300 | Tragic 3.4% |
| Immigrants | Dominican Republic | 0.2 /100 | #301 | Tragic 3.4% |
Demographics Similar to Immigrants from Canada by Professional Degree
In terms of professional degree, the demographic groups most similar to Immigrants from Canada are Immigrants from Ethiopia (5.3%, a difference of 0.040%), Immigrants from Indonesia (5.3%, a difference of 0.090%), Armenian (5.3%, a difference of 0.090%), Ethiopian (5.4%, a difference of 0.22%), and Immigrants from North America (5.3%, a difference of 0.26%).
| Demographics | Rating | Rank | Professional Degree |
| Immigrants | Hungary | 99.9 /100 | #69 | Exceptional 5.5% |
| Bhutanese | 99.8 /100 | #70 | Exceptional 5.4% |
| Immigrants | Western Asia | 99.8 /100 | #71 | Exceptional 5.4% |
| Lithuanians | 99.8 /100 | #72 | Exceptional 5.4% |
| Immigrants | Romania | 99.8 /100 | #73 | Exceptional 5.4% |
| Ethiopians | 99.7 /100 | #74 | Exceptional 5.4% |
| Immigrants | Indonesia | 99.7 /100 | #75 | Exceptional 5.3% |
| Immigrants | Canada | 99.7 /100 | #76 | Exceptional 5.3% |
| Immigrants | Ethiopia | 99.7 /100 | #77 | Exceptional 5.3% |
| Armenians | 99.7 /100 | #78 | Exceptional 5.3% |
| Immigrants | North America | 99.7 /100 | #79 | Exceptional 5.3% |
| Immigrants | England | 99.6 /100 | #80 | Exceptional 5.3% |
| Immigrants | Brazil | 99.6 /100 | #81 | Exceptional 5.3% |
| Romanians | 99.6 /100 | #82 | Exceptional 5.3% |
| Carpatho Rusyns | 99.6 /100 | #83 | Exceptional 5.3% |