Paiute vs Immigrants from El Salvador Hearing Disability
COMPARE
Paiute
Immigrants from El Salvador
Hearing Disability
Hearing Disability Comparison
Paiute
Immigrants from El Salvador
4.1%
HEARING DISABILITY
0.0/ 100
METRIC RATING
321st/ 347
METRIC RANK
2.6%
HEARING DISABILITY
99.7/ 100
METRIC RATING
25th/ 347
METRIC RANK
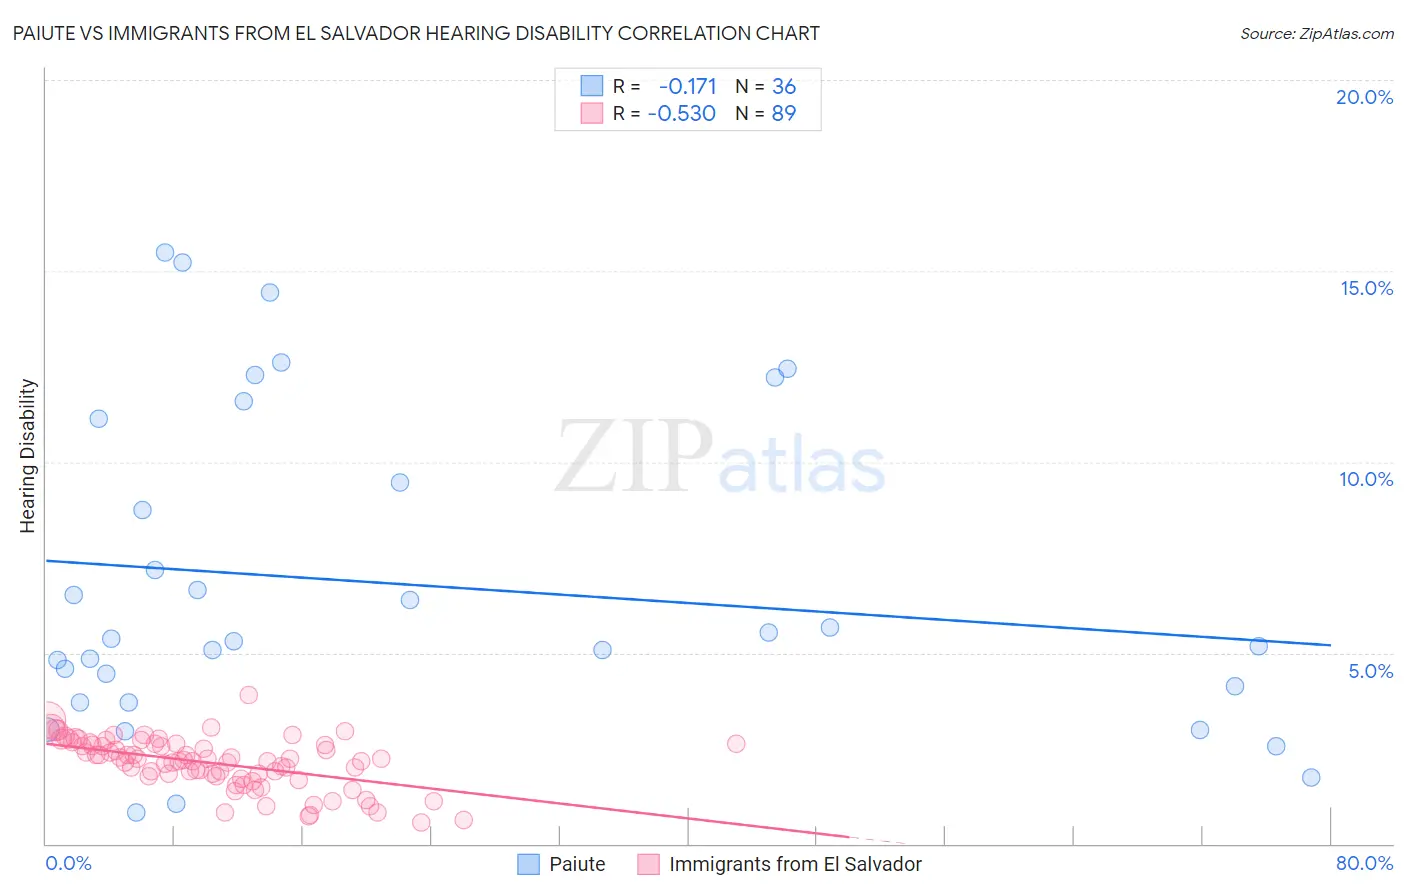
Paiute vs Immigrants from El Salvador Hearing Disability Correlation Chart
The statistical analysis conducted on geographies consisting of 58,392,251 people shows a poor negative correlation between the proportion of Paiute and percentage of population with hearing disability in the United States with a correlation coefficient (R) of -0.171 and weighted average of 4.1%. Similarly, the statistical analysis conducted on geographies consisting of 357,678,057 people shows a substantial negative correlation between the proportion of Immigrants from El Salvador and percentage of population with hearing disability in the United States with a correlation coefficient (R) of -0.530 and weighted average of 2.6%, a difference of 58.0%.
Hearing Disability Correlation Summary
| Measurement | Paiute | Immigrants from El Salvador |
| Minimum | 0.82% | 0.55% |
| Maximum | 15.5% | 3.9% |
| Range | 14.7% | 3.3% |
| Mean | 6.8% | 2.1% |
| Median | 5.3% | 2.2% |
| Interquartile 25% (IQ1) | 3.9% | 1.8% |
| Interquartile 75% (IQ3) | 10.3% | 2.6% |
| Interquartile Range (IQR) | 6.4% | 0.86% |
| Standard Deviation (Sample) | 4.1% | 0.67% |
| Standard Deviation (Population) | 4.1% | 0.66% |
Similar Demographics by Hearing Disability
Demographics Similar to Paiute by Hearing Disability
In terms of hearing disability, the demographic groups most similar to Paiute are Seminole (4.1%, a difference of 0.26%), Apache (4.1%, a difference of 0.38%), Osage (4.1%, a difference of 0.45%), Lumbee (4.1%, a difference of 0.77%), and Potawatomi (4.1%, a difference of 1.1%).
| Demographics | Rating | Rank | Hearing Disability |
| Yakama | 0.0 /100 | #314 | Tragic 3.9% |
| Puget Sound Salish | 0.0 /100 | #315 | Tragic 3.9% |
| Spanish Americans | 0.0 /100 | #316 | Tragic 4.0% |
| Comanche | 0.0 /100 | #317 | Tragic 4.0% |
| Cheyenne | 0.0 /100 | #318 | Tragic 4.0% |
| Chippewa | 0.0 /100 | #319 | Tragic 4.0% |
| Shoshone | 0.0 /100 | #320 | Tragic 4.0% |
| Paiute | 0.0 /100 | #321 | Tragic 4.1% |
| Seminole | 0.0 /100 | #322 | Tragic 4.1% |
| Apache | 0.0 /100 | #323 | Tragic 4.1% |
| Osage | 0.0 /100 | #324 | Tragic 4.1% |
| Lumbee | 0.0 /100 | #325 | Tragic 4.1% |
| Potawatomi | 0.0 /100 | #326 | Tragic 4.1% |
| Arapaho | 0.0 /100 | #327 | Tragic 4.1% |
| Tohono O'odham | 0.0 /100 | #328 | Tragic 4.2% |
Demographics Similar to Immigrants from El Salvador by Hearing Disability
In terms of hearing disability, the demographic groups most similar to Immigrants from El Salvador are Immigrants from Senegal (2.6%, a difference of 0.010%), Immigrants from South Central Asia (2.6%, a difference of 0.050%), Immigrants from Ghana (2.6%, a difference of 0.40%), Immigrants from Haiti (2.6%, a difference of 0.42%), and Bolivian (2.6%, a difference of 0.45%).
| Demographics | Rating | Rank | Hearing Disability |
| Dominicans | 99.8 /100 | #18 | Exceptional 2.5% |
| Thais | 99.8 /100 | #19 | Exceptional 2.5% |
| Immigrants | Bolivia | 99.8 /100 | #20 | Exceptional 2.5% |
| Ghanaians | 99.8 /100 | #21 | Exceptional 2.5% |
| Immigrants | Sierra Leone | 99.8 /100 | #22 | Exceptional 2.6% |
| Immigrants | Nigeria | 99.8 /100 | #23 | Exceptional 2.6% |
| Immigrants | Ghana | 99.8 /100 | #24 | Exceptional 2.6% |
| Immigrants | El Salvador | 99.7 /100 | #25 | Exceptional 2.6% |
| Immigrants | Senegal | 99.7 /100 | #26 | Exceptional 2.6% |
| Immigrants | South Central Asia | 99.7 /100 | #27 | Exceptional 2.6% |
| Immigrants | Haiti | 99.7 /100 | #28 | Exceptional 2.6% |
| Bolivians | 99.7 /100 | #29 | Exceptional 2.6% |
| Immigrants | Caribbean | 99.7 /100 | #30 | Exceptional 2.6% |
| Immigrants | Cameroon | 99.7 /100 | #31 | Exceptional 2.6% |
| Immigrants | Venezuela | 99.7 /100 | #32 | Exceptional 2.6% |