Paiute vs Immigrants from Eastern Africa 10th Grade
COMPARE
Paiute
Immigrants from Eastern Africa
10th Grade
10th Grade Comparison
Paiute
Immigrants from Eastern Africa
92.6%
10TH GRADE
0.4/ 100
METRIC RATING
261st/ 347
METRIC RANK
93.4%
10TH GRADE
14.7/ 100
METRIC RATING
216th/ 347
METRIC RANK
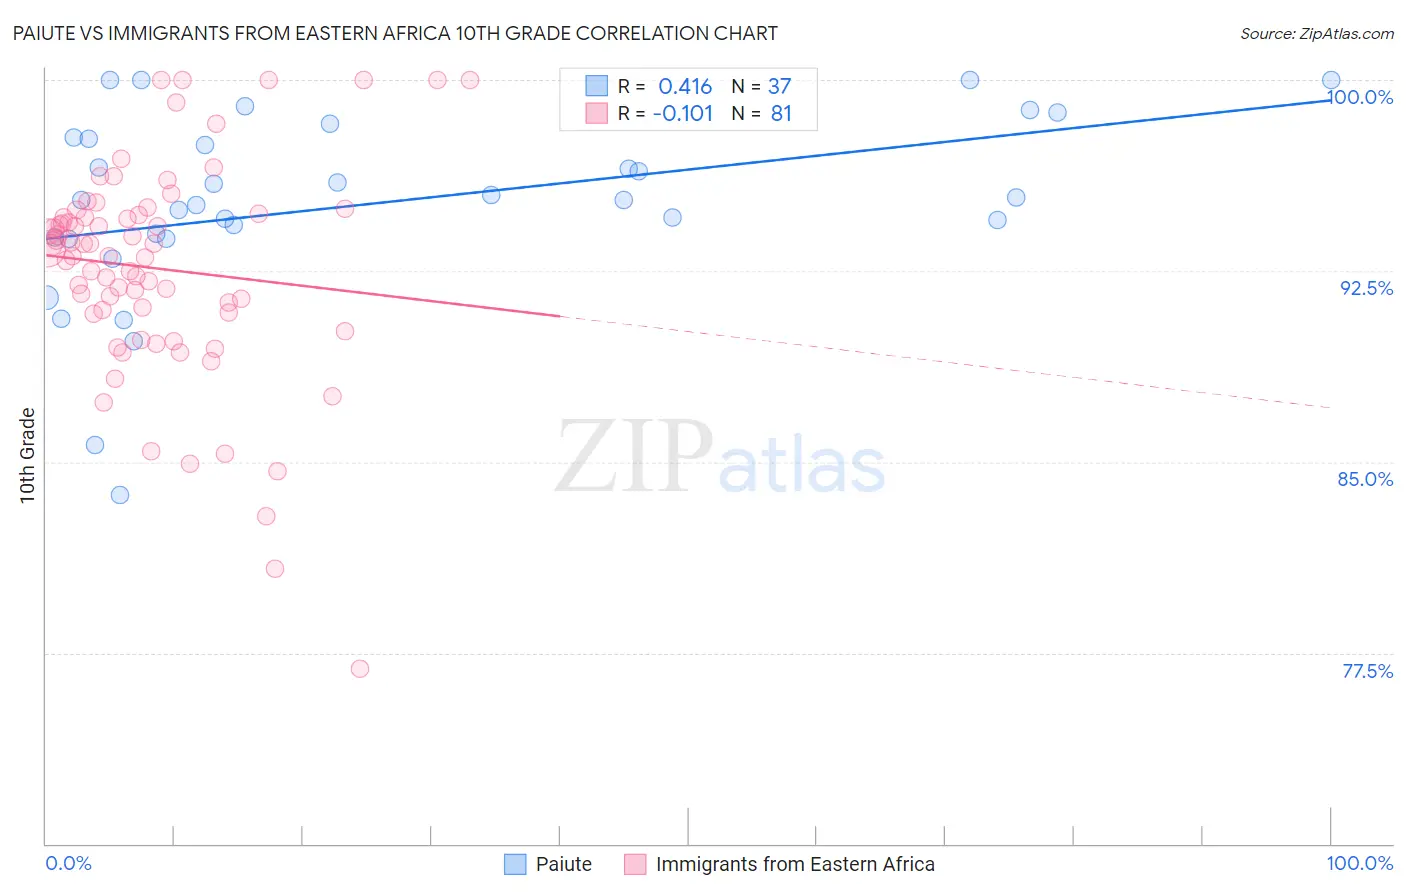
Paiute vs Immigrants from Eastern Africa 10th Grade Correlation Chart
The statistical analysis conducted on geographies consisting of 58,403,520 people shows a moderate positive correlation between the proportion of Paiute and percentage of population with at least 10th grade education in the United States with a correlation coefficient (R) of 0.416 and weighted average of 92.6%. Similarly, the statistical analysis conducted on geographies consisting of 355,144,184 people shows a poor negative correlation between the proportion of Immigrants from Eastern Africa and percentage of population with at least 10th grade education in the United States with a correlation coefficient (R) of -0.101 and weighted average of 93.4%, a difference of 0.83%.
10th Grade Correlation Summary
| Measurement | Paiute | Immigrants from Eastern Africa |
| Minimum | 83.7% | 76.9% |
| Maximum | 100.0% | 100.0% |
| Range | 16.3% | 23.1% |
| Mean | 95.1% | 92.6% |
| Median | 95.3% | 93.4% |
| Interquartile 25% (IQ1) | 93.8% | 90.8% |
| Interquartile 75% (IQ3) | 97.7% | 94.7% |
| Interquartile Range (IQR) | 3.9% | 3.9% |
| Standard Deviation (Sample) | 3.7% | 4.3% |
| Standard Deviation (Population) | 3.6% | 4.2% |
Similar Demographics by 10th Grade
Demographics Similar to Paiute by 10th Grade
In terms of 10th grade, the demographic groups most similar to Paiute are Immigrants from South America (92.6%, a difference of 0.010%), Apache (92.6%, a difference of 0.010%), Peruvian (92.6%, a difference of 0.010%), Immigrants from Uzbekistan (92.6%, a difference of 0.040%), and Dutch West Indian (92.6%, a difference of 0.040%).
| Demographics | Rating | Rank | 10th Grade |
| Armenians | 0.9 /100 | #254 | Tragic 92.7% |
| Immigrants | Bolivia | 0.7 /100 | #255 | Tragic 92.7% |
| Immigrants | Nigeria | 0.7 /100 | #256 | Tragic 92.7% |
| U.S. Virgin Islanders | 0.7 /100 | #257 | Tragic 92.7% |
| Immigrants | Costa Rica | 0.6 /100 | #258 | Tragic 92.7% |
| Immigrants | Jamaica | 0.5 /100 | #259 | Tragic 92.6% |
| Immigrants | Uzbekistan | 0.5 /100 | #260 | Tragic 92.6% |
| Paiute | 0.4 /100 | #261 | Tragic 92.6% |
| Immigrants | South America | 0.4 /100 | #262 | Tragic 92.6% |
| Apache | 0.4 /100 | #263 | Tragic 92.6% |
| Peruvians | 0.4 /100 | #264 | Tragic 92.6% |
| Dutch West Indians | 0.4 /100 | #265 | Tragic 92.6% |
| Immigrants | Philippines | 0.4 /100 | #266 | Tragic 92.6% |
| Taiwanese | 0.3 /100 | #267 | Tragic 92.5% |
| Immigrants | Ghana | 0.3 /100 | #268 | Tragic 92.5% |
Demographics Similar to Immigrants from Eastern Africa by 10th Grade
In terms of 10th grade, the demographic groups most similar to Immigrants from Eastern Africa are Immigrants from Bahamas (93.4%, a difference of 0.010%), Immigrants from Oceania (93.4%, a difference of 0.010%), Immigrants from Asia (93.4%, a difference of 0.020%), Immigrants from Zaire (93.4%, a difference of 0.030%), and Cajun (93.4%, a difference of 0.040%).
| Demographics | Rating | Rank | 10th Grade |
| Immigrants | Chile | 18.8 /100 | #209 | Poor 93.4% |
| Indians (Asian) | 17.6 /100 | #210 | Poor 93.4% |
| Cajuns | 16.9 /100 | #211 | Poor 93.4% |
| Immigrants | Zaire | 16.7 /100 | #212 | Poor 93.4% |
| Immigrants | Asia | 15.7 /100 | #213 | Poor 93.4% |
| Immigrants | Bahamas | 15.2 /100 | #214 | Poor 93.4% |
| Immigrants | Oceania | 15.1 /100 | #215 | Poor 93.4% |
| Immigrants | Eastern Africa | 14.7 /100 | #216 | Poor 93.4% |
| Portuguese | 12.1 /100 | #217 | Poor 93.3% |
| Immigrants | Liberia | 10.2 /100 | #218 | Poor 93.3% |
| Seminole | 10.2 /100 | #219 | Poor 93.3% |
| Tongans | 9.5 /100 | #220 | Tragic 93.3% |
| Immigrants | Southern Europe | 8.9 /100 | #221 | Tragic 93.2% |
| Ethiopians | 7.9 /100 | #222 | Tragic 93.2% |
| Immigrants | Sierra Leone | 7.6 /100 | #223 | Tragic 93.2% |