Immigrants from Mexico vs Immigrants from Eastern Africa 10th Grade
COMPARE
Immigrants from Mexico
Immigrants from Eastern Africa
10th Grade
10th Grade Comparison
Immigrants from Mexico
Immigrants from Eastern Africa
86.2%
10TH GRADE
0.0/ 100
METRIC RATING
347th/ 347
METRIC RANK
93.4%
10TH GRADE
14.7/ 100
METRIC RATING
216th/ 347
METRIC RANK
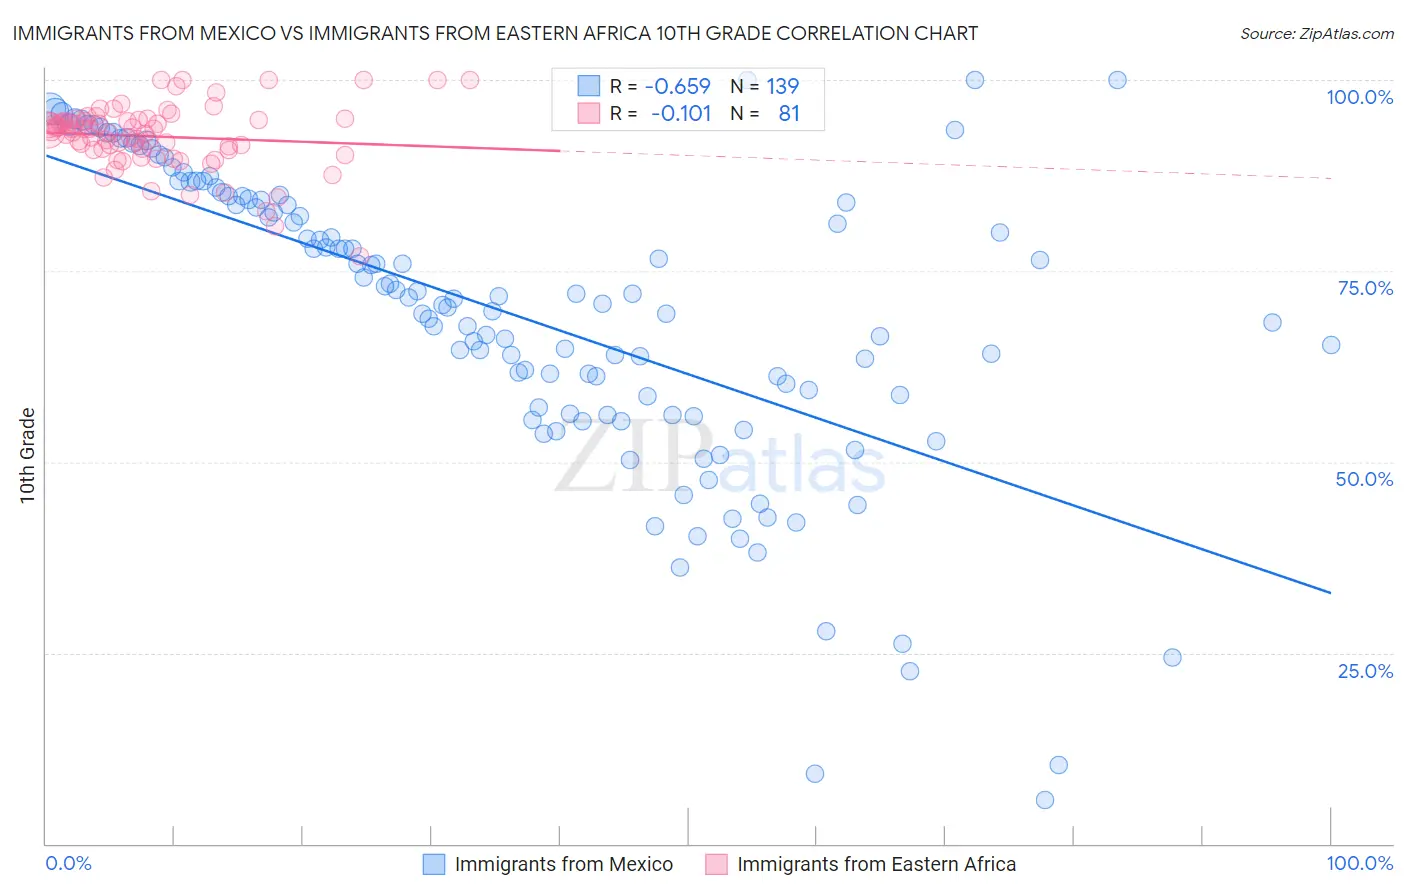
Immigrants from Mexico vs Immigrants from Eastern Africa 10th Grade Correlation Chart
The statistical analysis conducted on geographies consisting of 513,766,684 people shows a significant negative correlation between the proportion of Immigrants from Mexico and percentage of population with at least 10th grade education in the United States with a correlation coefficient (R) of -0.659 and weighted average of 86.2%. Similarly, the statistical analysis conducted on geographies consisting of 355,144,184 people shows a poor negative correlation between the proportion of Immigrants from Eastern Africa and percentage of population with at least 10th grade education in the United States with a correlation coefficient (R) of -0.101 and weighted average of 93.4%, a difference of 8.3%.
10th Grade Correlation Summary
| Measurement | Immigrants from Mexico | Immigrants from Eastern Africa |
| Minimum | 5.7% | 76.9% |
| Maximum | 100.0% | 100.0% |
| Range | 94.3% | 23.1% |
| Mean | 69.4% | 92.6% |
| Median | 71.5% | 93.4% |
| Interquartile 25% (IQ1) | 57.2% | 90.8% |
| Interquartile 75% (IQ3) | 84.8% | 94.7% |
| Interquartile Range (IQR) | 27.6% | 3.9% |
| Standard Deviation (Sample) | 19.7% | 4.3% |
| Standard Deviation (Population) | 19.7% | 4.2% |
Similar Demographics by 10th Grade
Demographics Similar to Immigrants from Mexico by 10th Grade
In terms of 10th grade, the demographic groups most similar to Immigrants from Mexico are Spanish American Indian (86.2%, a difference of 0.010%), Immigrants from Central America (86.6%, a difference of 0.47%), Immigrants from El Salvador (86.8%, a difference of 0.65%), Yakama (86.9%, a difference of 0.78%), and Immigrants from Guatemala (87.4%, a difference of 1.4%).
| Demographics | Rating | Rank | 10th Grade |
| Hondurans | 0.0 /100 | #333 | Tragic 89.0% |
| Hispanics or Latinos | 0.0 /100 | #334 | Tragic 88.9% |
| Immigrants | Dominican Republic | 0.0 /100 | #335 | Tragic 88.7% |
| Immigrants | Honduras | 0.0 /100 | #336 | Tragic 88.5% |
| Central Americans | 0.0 /100 | #337 | Tragic 88.4% |
| Immigrants | Latin America | 0.0 /100 | #338 | Tragic 88.3% |
| Guatemalans | 0.0 /100 | #339 | Tragic 87.9% |
| Mexicans | 0.0 /100 | #340 | Tragic 87.8% |
| Salvadorans | 0.0 /100 | #341 | Tragic 87.5% |
| Immigrants | Guatemala | 0.0 /100 | #342 | Tragic 87.4% |
| Yakama | 0.0 /100 | #343 | Tragic 86.9% |
| Immigrants | El Salvador | 0.0 /100 | #344 | Tragic 86.8% |
| Immigrants | Central America | 0.0 /100 | #345 | Tragic 86.6% |
| Spanish American Indians | 0.0 /100 | #346 | Tragic 86.2% |
| Immigrants | Mexico | 0.0 /100 | #347 | Tragic 86.2% |
Demographics Similar to Immigrants from Eastern Africa by 10th Grade
In terms of 10th grade, the demographic groups most similar to Immigrants from Eastern Africa are Immigrants from Bahamas (93.4%, a difference of 0.010%), Immigrants from Oceania (93.4%, a difference of 0.010%), Immigrants from Asia (93.4%, a difference of 0.020%), Immigrants from Zaire (93.4%, a difference of 0.030%), and Cajun (93.4%, a difference of 0.040%).
| Demographics | Rating | Rank | 10th Grade |
| Immigrants | Chile | 18.8 /100 | #209 | Poor 93.4% |
| Indians (Asian) | 17.6 /100 | #210 | Poor 93.4% |
| Cajuns | 16.9 /100 | #211 | Poor 93.4% |
| Immigrants | Zaire | 16.7 /100 | #212 | Poor 93.4% |
| Immigrants | Asia | 15.7 /100 | #213 | Poor 93.4% |
| Immigrants | Bahamas | 15.2 /100 | #214 | Poor 93.4% |
| Immigrants | Oceania | 15.1 /100 | #215 | Poor 93.4% |
| Immigrants | Eastern Africa | 14.7 /100 | #216 | Poor 93.4% |
| Portuguese | 12.1 /100 | #217 | Poor 93.3% |
| Immigrants | Liberia | 10.2 /100 | #218 | Poor 93.3% |
| Seminole | 10.2 /100 | #219 | Poor 93.3% |
| Tongans | 9.5 /100 | #220 | Tragic 93.3% |
| Immigrants | Southern Europe | 8.9 /100 | #221 | Tragic 93.2% |
| Ethiopians | 7.9 /100 | #222 | Tragic 93.2% |
| Immigrants | Sierra Leone | 7.6 /100 | #223 | Tragic 93.2% |