Paiute vs Immigrants from Middle Africa 10th Grade
COMPARE
Paiute
Immigrants from Middle Africa
10th Grade
10th Grade Comparison
Paiute
Immigrants from Middle Africa
92.6%
10TH GRADE
0.4/ 100
METRIC RATING
261st/ 347
METRIC RANK
92.9%
10TH GRADE
1.7/ 100
METRIC RATING
246th/ 347
METRIC RANK
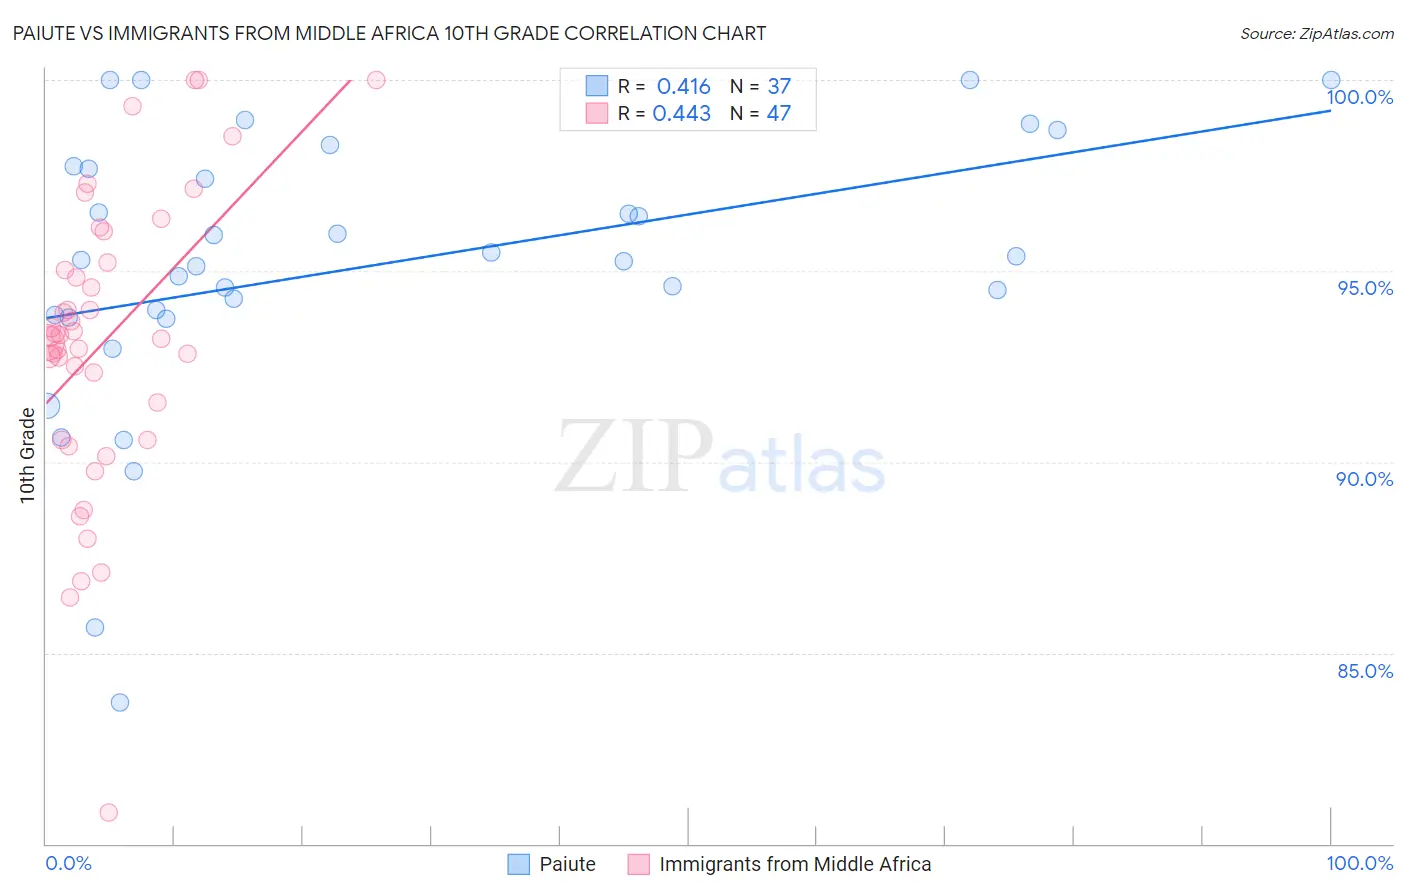
Paiute vs Immigrants from Middle Africa 10th Grade Correlation Chart
The statistical analysis conducted on geographies consisting of 58,403,520 people shows a moderate positive correlation between the proportion of Paiute and percentage of population with at least 10th grade education in the United States with a correlation coefficient (R) of 0.416 and weighted average of 92.6%. Similarly, the statistical analysis conducted on geographies consisting of 202,726,551 people shows a moderate positive correlation between the proportion of Immigrants from Middle Africa and percentage of population with at least 10th grade education in the United States with a correlation coefficient (R) of 0.443 and weighted average of 92.9%, a difference of 0.31%.
10th Grade Correlation Summary
| Measurement | Paiute | Immigrants from Middle Africa |
| Minimum | 83.7% | 80.8% |
| Maximum | 100.0% | 100.0% |
| Range | 16.3% | 19.2% |
| Mean | 95.1% | 93.1% |
| Median | 95.3% | 93.3% |
| Interquartile 25% (IQ1) | 93.8% | 90.6% |
| Interquartile 75% (IQ3) | 97.7% | 95.2% |
| Interquartile Range (IQR) | 3.9% | 4.6% |
| Standard Deviation (Sample) | 3.7% | 3.9% |
| Standard Deviation (Population) | 3.6% | 3.8% |
Demographics Similar to Paiute and Immigrants from Middle Africa by 10th Grade
In terms of 10th grade, the demographic groups most similar to Paiute are Immigrants from South America (92.6%, a difference of 0.010%), Apache (92.6%, a difference of 0.010%), Immigrants from Uzbekistan (92.6%, a difference of 0.040%), Immigrants from Jamaica (92.6%, a difference of 0.050%), and Immigrants from Costa Rica (92.7%, a difference of 0.080%). Similarly, the demographic groups most similar to Immigrants from Middle Africa are Uruguayan (92.9%, a difference of 0.020%), Immigrants from Afghanistan (92.8%, a difference of 0.040%), Spanish American (92.9%, a difference of 0.050%), Colombian (92.8%, a difference of 0.050%), and Immigrants from Senegal (92.8%, a difference of 0.050%).
| Demographics | Rating | Rank | 10th Grade |
| Senegalese | 2.4 /100 | #243 | Tragic 93.0% |
| Spanish Americans | 2.1 /100 | #244 | Tragic 92.9% |
| Uruguayans | 1.8 /100 | #245 | Tragic 92.9% |
| Immigrants | Middle Africa | 1.7 /100 | #246 | Tragic 92.9% |
| Immigrants | Afghanistan | 1.4 /100 | #247 | Tragic 92.8% |
| Colombians | 1.4 /100 | #248 | Tragic 92.8% |
| Immigrants | Senegal | 1.4 /100 | #249 | Tragic 92.8% |
| Jamaicans | 1.2 /100 | #250 | Tragic 92.8% |
| Immigrants | Thailand | 1.0 /100 | #251 | Tragic 92.8% |
| South Americans | 0.9 /100 | #252 | Tragic 92.8% |
| Ghanaians | 0.9 /100 | #253 | Tragic 92.8% |
| Armenians | 0.9 /100 | #254 | Tragic 92.7% |
| Immigrants | Bolivia | 0.7 /100 | #255 | Tragic 92.7% |
| Immigrants | Nigeria | 0.7 /100 | #256 | Tragic 92.7% |
| U.S. Virgin Islanders | 0.7 /100 | #257 | Tragic 92.7% |
| Immigrants | Costa Rica | 0.6 /100 | #258 | Tragic 92.7% |
| Immigrants | Jamaica | 0.5 /100 | #259 | Tragic 92.6% |
| Immigrants | Uzbekistan | 0.5 /100 | #260 | Tragic 92.6% |
| Paiute | 0.4 /100 | #261 | Tragic 92.6% |
| Immigrants | South America | 0.4 /100 | #262 | Tragic 92.6% |
| Apache | 0.4 /100 | #263 | Tragic 92.6% |