Paiute vs Immigrants from Panama 10th Grade
COMPARE
Paiute
Immigrants from Panama
10th Grade
10th Grade Comparison
Paiute
Immigrants from Panama
92.6%
10TH GRADE
0.4/ 100
METRIC RATING
261st/ 347
METRIC RANK
93.1%
10TH GRADE
4.3/ 100
METRIC RATING
237th/ 347
METRIC RANK
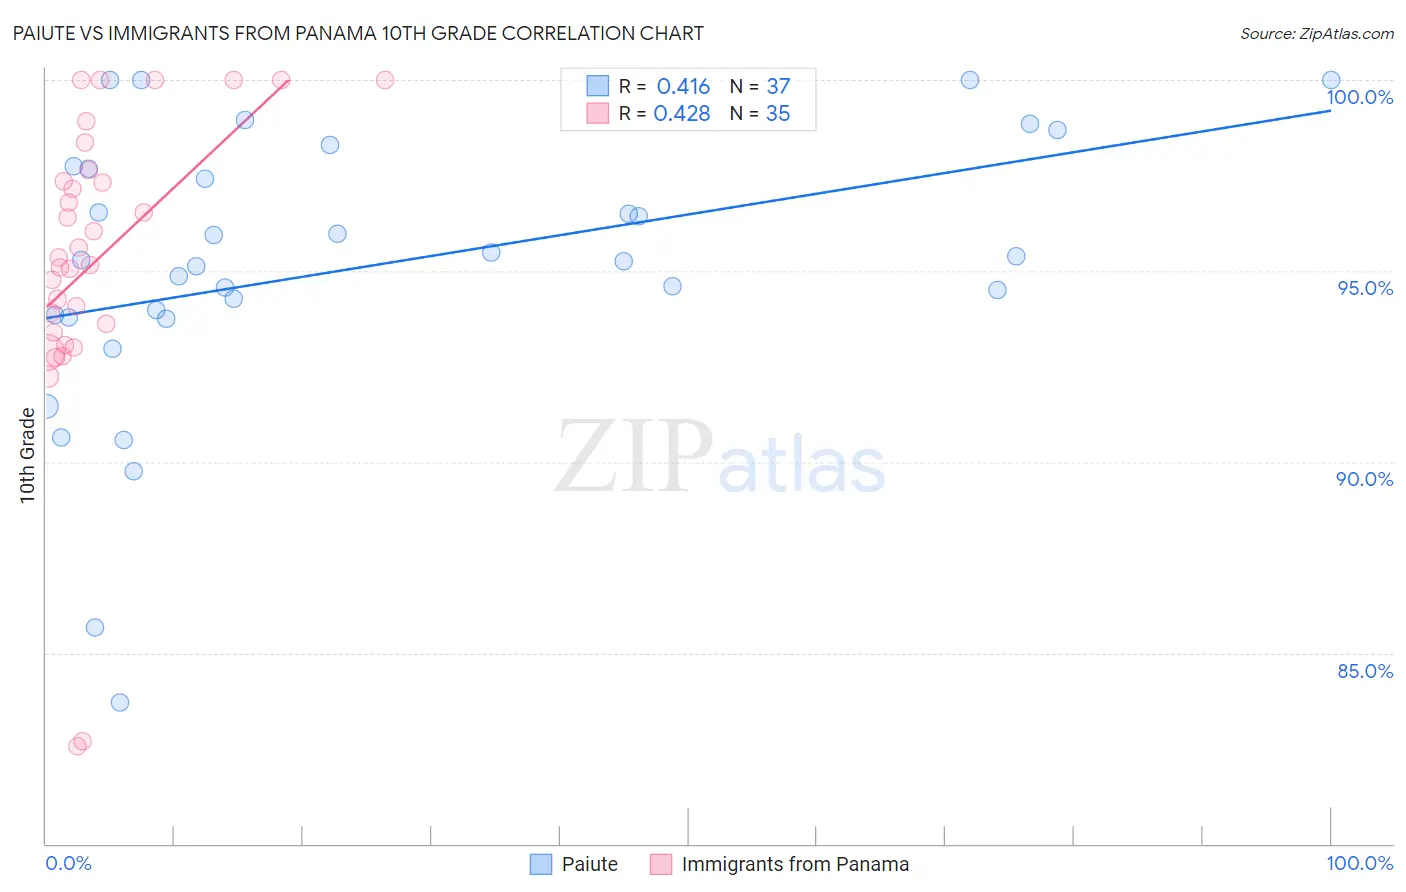
Paiute vs Immigrants from Panama 10th Grade Correlation Chart
The statistical analysis conducted on geographies consisting of 58,403,520 people shows a moderate positive correlation between the proportion of Paiute and percentage of population with at least 10th grade education in the United States with a correlation coefficient (R) of 0.416 and weighted average of 92.6%. Similarly, the statistical analysis conducted on geographies consisting of 221,183,192 people shows a moderate positive correlation between the proportion of Immigrants from Panama and percentage of population with at least 10th grade education in the United States with a correlation coefficient (R) of 0.428 and weighted average of 93.1%, a difference of 0.53%.
10th Grade Correlation Summary
| Measurement | Paiute | Immigrants from Panama |
| Minimum | 83.7% | 82.6% |
| Maximum | 100.0% | 100.0% |
| Range | 16.3% | 17.4% |
| Mean | 95.1% | 95.3% |
| Median | 95.3% | 95.4% |
| Interquartile 25% (IQ1) | 93.8% | 93.4% |
| Interquartile 75% (IQ3) | 97.7% | 97.6% |
| Interquartile Range (IQR) | 3.9% | 4.3% |
| Standard Deviation (Sample) | 3.7% | 4.0% |
| Standard Deviation (Population) | 3.6% | 4.0% |
Similar Demographics by 10th Grade
Demographics Similar to Paiute by 10th Grade
In terms of 10th grade, the demographic groups most similar to Paiute are Immigrants from South America (92.6%, a difference of 0.010%), Apache (92.6%, a difference of 0.010%), Peruvian (92.6%, a difference of 0.010%), Immigrants from Uzbekistan (92.6%, a difference of 0.040%), and Dutch West Indian (92.6%, a difference of 0.040%).
| Demographics | Rating | Rank | 10th Grade |
| Armenians | 0.9 /100 | #254 | Tragic 92.7% |
| Immigrants | Bolivia | 0.7 /100 | #255 | Tragic 92.7% |
| Immigrants | Nigeria | 0.7 /100 | #256 | Tragic 92.7% |
| U.S. Virgin Islanders | 0.7 /100 | #257 | Tragic 92.7% |
| Immigrants | Costa Rica | 0.6 /100 | #258 | Tragic 92.7% |
| Immigrants | Jamaica | 0.5 /100 | #259 | Tragic 92.6% |
| Immigrants | Uzbekistan | 0.5 /100 | #260 | Tragic 92.6% |
| Paiute | 0.4 /100 | #261 | Tragic 92.6% |
| Immigrants | South America | 0.4 /100 | #262 | Tragic 92.6% |
| Apache | 0.4 /100 | #263 | Tragic 92.6% |
| Peruvians | 0.4 /100 | #264 | Tragic 92.6% |
| Dutch West Indians | 0.4 /100 | #265 | Tragic 92.6% |
| Immigrants | Philippines | 0.4 /100 | #266 | Tragic 92.6% |
| Taiwanese | 0.3 /100 | #267 | Tragic 92.5% |
| Immigrants | Ghana | 0.3 /100 | #268 | Tragic 92.5% |
Demographics Similar to Immigrants from Panama by 10th Grade
In terms of 10th grade, the demographic groups most similar to Immigrants from Panama are African (93.1%, a difference of 0.010%), Afghan (93.1%, a difference of 0.010%), Nigerian (93.1%, a difference of 0.010%), Costa Rican (93.1%, a difference of 0.010%), and Immigrants from Hong Kong (93.1%, a difference of 0.010%).
| Demographics | Rating | Rank | 10th Grade |
| Immigrants | Africa | 5.0 /100 | #230 | Tragic 93.1% |
| South American Indians | 4.9 /100 | #231 | Tragic 93.1% |
| Bahamians | 4.9 /100 | #232 | Tragic 93.1% |
| Comanche | 4.9 /100 | #233 | Tragic 93.1% |
| Sub-Saharan Africans | 4.7 /100 | #234 | Tragic 93.1% |
| Africans | 4.6 /100 | #235 | Tragic 93.1% |
| Afghans | 4.5 /100 | #236 | Tragic 93.1% |
| Immigrants | Panama | 4.3 /100 | #237 | Tragic 93.1% |
| Nigerians | 4.2 /100 | #238 | Tragic 93.1% |
| Costa Ricans | 4.2 /100 | #239 | Tragic 93.1% |
| Immigrants | Hong Kong | 4.2 /100 | #240 | Tragic 93.1% |
| Immigrants | Somalia | 2.7 /100 | #241 | Tragic 93.0% |
| Immigrants | Cameroon | 2.6 /100 | #242 | Tragic 93.0% |
| Senegalese | 2.4 /100 | #243 | Tragic 93.0% |
| Spanish Americans | 2.1 /100 | #244 | Tragic 92.9% |