Paiute vs Yugoslavian 10th Grade
COMPARE
Paiute
Yugoslavian
10th Grade
10th Grade Comparison
Paiute
Yugoslavians
92.6%
10TH GRADE
0.4/ 100
METRIC RATING
261st/ 347
METRIC RANK
94.6%
10TH GRADE
98.4/ 100
METRIC RATING
92nd/ 347
METRIC RANK
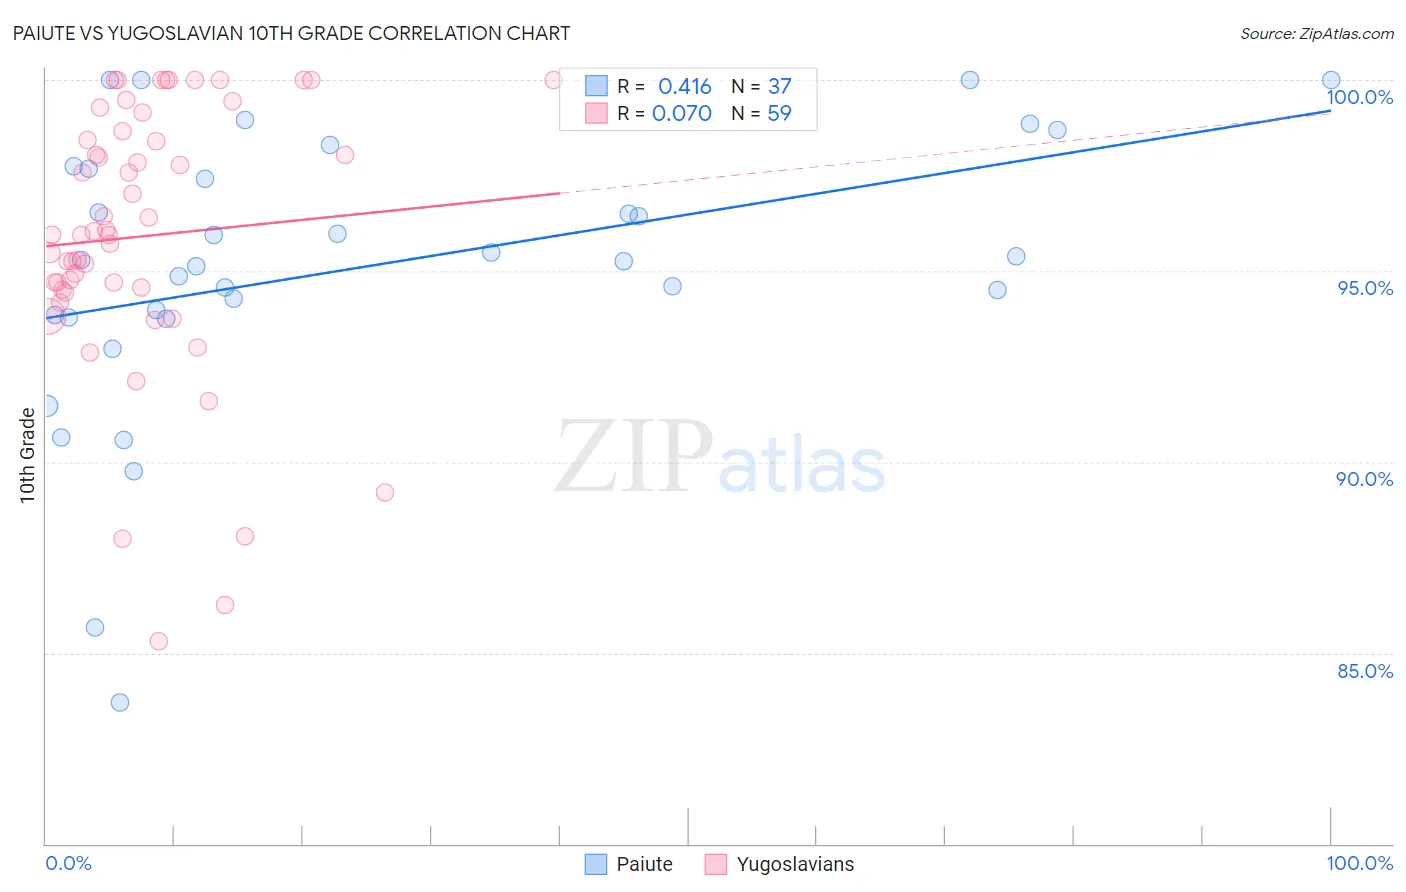
Paiute vs Yugoslavian 10th Grade Correlation Chart
The statistical analysis conducted on geographies consisting of 58,403,520 people shows a moderate positive correlation between the proportion of Paiute and percentage of population with at least 10th grade education in the United States with a correlation coefficient (R) of 0.416 and weighted average of 92.6%. Similarly, the statistical analysis conducted on geographies consisting of 285,719,638 people shows a slight positive correlation between the proportion of Yugoslavians and percentage of population with at least 10th grade education in the United States with a correlation coefficient (R) of 0.070 and weighted average of 94.6%, a difference of 2.2%.
10th Grade Correlation Summary
| Measurement | Paiute | Yugoslavian |
| Minimum | 83.7% | 85.3% |
| Maximum | 100.0% | 100.0% |
| Range | 16.3% | 14.7% |
| Mean | 95.1% | 95.9% |
| Median | 95.3% | 95.9% |
| Interquartile 25% (IQ1) | 93.8% | 94.5% |
| Interquartile 75% (IQ3) | 97.7% | 98.7% |
| Interquartile Range (IQR) | 3.9% | 4.1% |
| Standard Deviation (Sample) | 3.7% | 3.5% |
| Standard Deviation (Population) | 3.6% | 3.5% |
Similar Demographics by 10th Grade
Demographics Similar to Paiute by 10th Grade
In terms of 10th grade, the demographic groups most similar to Paiute are Immigrants from South America (92.6%, a difference of 0.010%), Apache (92.6%, a difference of 0.010%), Peruvian (92.6%, a difference of 0.010%), Immigrants from Uzbekistan (92.6%, a difference of 0.040%), and Dutch West Indian (92.6%, a difference of 0.040%).
| Demographics | Rating | Rank | 10th Grade |
| Armenians | 0.9 /100 | #254 | Tragic 92.7% |
| Immigrants | Bolivia | 0.7 /100 | #255 | Tragic 92.7% |
| Immigrants | Nigeria | 0.7 /100 | #256 | Tragic 92.7% |
| U.S. Virgin Islanders | 0.7 /100 | #257 | Tragic 92.7% |
| Immigrants | Costa Rica | 0.6 /100 | #258 | Tragic 92.7% |
| Immigrants | Jamaica | 0.5 /100 | #259 | Tragic 92.6% |
| Immigrants | Uzbekistan | 0.5 /100 | #260 | Tragic 92.6% |
| Paiute | 0.4 /100 | #261 | Tragic 92.6% |
| Immigrants | South America | 0.4 /100 | #262 | Tragic 92.6% |
| Apache | 0.4 /100 | #263 | Tragic 92.6% |
| Peruvians | 0.4 /100 | #264 | Tragic 92.6% |
| Dutch West Indians | 0.4 /100 | #265 | Tragic 92.6% |
| Immigrants | Philippines | 0.4 /100 | #266 | Tragic 92.6% |
| Taiwanese | 0.3 /100 | #267 | Tragic 92.5% |
| Immigrants | Ghana | 0.3 /100 | #268 | Tragic 92.5% |
Demographics Similar to Yugoslavians by 10th Grade
In terms of 10th grade, the demographic groups most similar to Yugoslavians are Soviet Union (94.6%, a difference of 0.010%), Immigrants from Germany (94.6%, a difference of 0.010%), Menominee (94.6%, a difference of 0.010%), Immigrants from Switzerland (94.6%, a difference of 0.020%), and Lebanese (94.6%, a difference of 0.020%).
| Demographics | Rating | Rank | 10th Grade |
| Crow | 99.0 /100 | #85 | Exceptional 94.7% |
| Puget Sound Salish | 99.0 /100 | #86 | Exceptional 94.7% |
| Immigrants | Saudi Arabia | 99.0 /100 | #87 | Exceptional 94.7% |
| Immigrants | Japan | 99.0 /100 | #88 | Exceptional 94.7% |
| Immigrants | Moldova | 98.9 /100 | #89 | Exceptional 94.7% |
| South Africans | 98.8 /100 | #90 | Exceptional 94.7% |
| Whites/Caucasians | 98.8 /100 | #91 | Exceptional 94.7% |
| Yugoslavians | 98.4 /100 | #92 | Exceptional 94.6% |
| Soviet Union | 98.3 /100 | #93 | Exceptional 94.6% |
| Immigrants | Germany | 98.3 /100 | #94 | Exceptional 94.6% |
| Menominee | 98.3 /100 | #95 | Exceptional 94.6% |
| Immigrants | Switzerland | 98.3 /100 | #96 | Exceptional 94.6% |
| Lebanese | 98.3 /100 | #97 | Exceptional 94.6% |
| Immigrants | Bulgaria | 98.1 /100 | #98 | Exceptional 94.6% |
| Immigrants | France | 97.9 /100 | #99 | Exceptional 94.5% |