Egyptian vs Immigrants from Eastern Africa 10th Grade
COMPARE
Egyptian
Immigrants from Eastern Africa
10th Grade
10th Grade Comparison
Egyptians
Immigrants from Eastern Africa
94.0%
10TH GRADE
79.6/ 100
METRIC RATING
150th/ 347
METRIC RANK
93.4%
10TH GRADE
14.7/ 100
METRIC RATING
216th/ 347
METRIC RANK
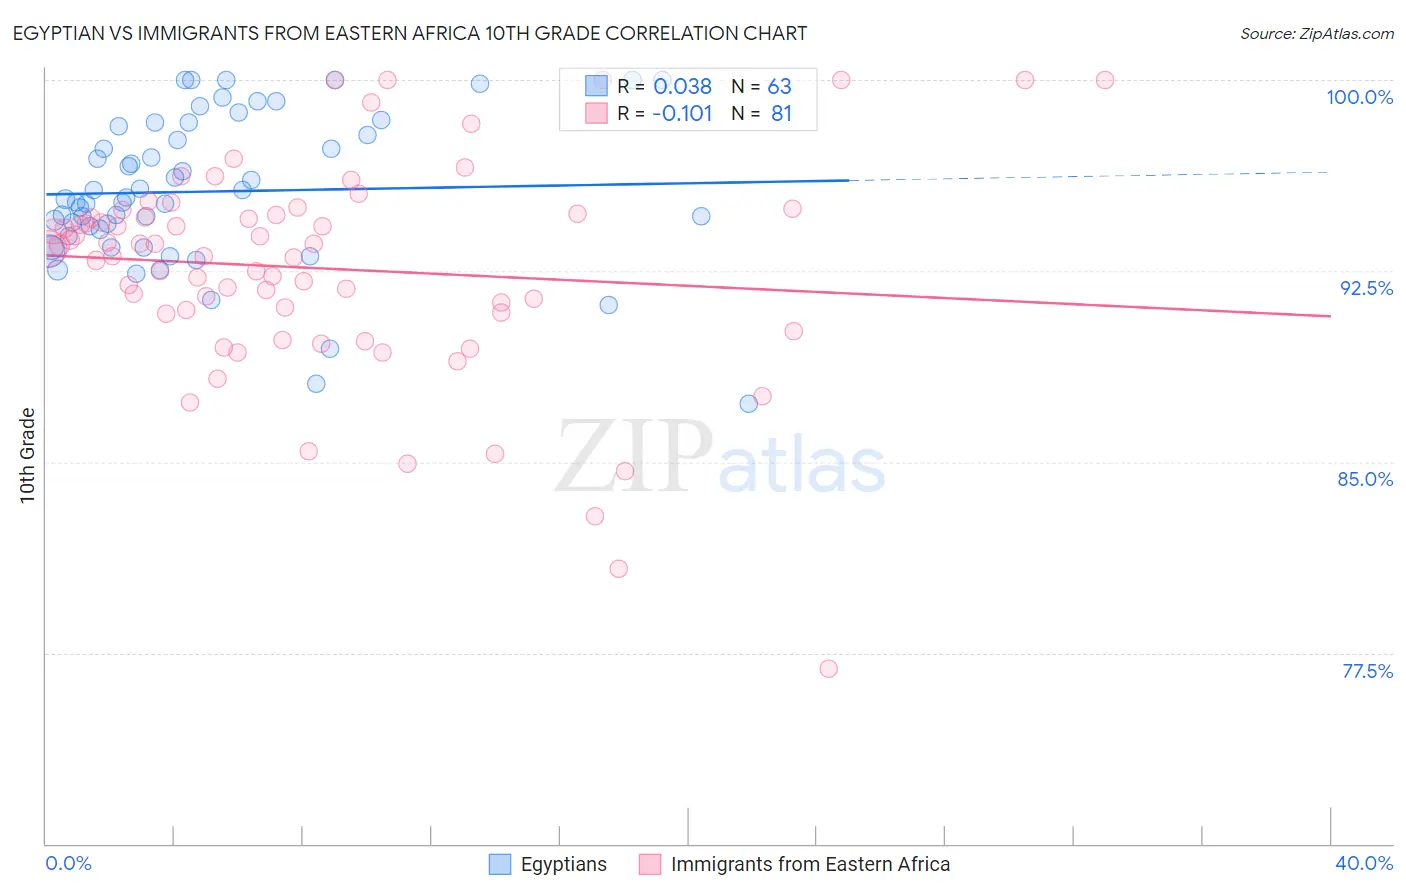
Egyptian vs Immigrants from Eastern Africa 10th Grade Correlation Chart
The statistical analysis conducted on geographies consisting of 276,927,519 people shows no correlation between the proportion of Egyptians and percentage of population with at least 10th grade education in the United States with a correlation coefficient (R) of 0.038 and weighted average of 94.0%. Similarly, the statistical analysis conducted on geographies consisting of 355,144,184 people shows a poor negative correlation between the proportion of Immigrants from Eastern Africa and percentage of population with at least 10th grade education in the United States with a correlation coefficient (R) of -0.101 and weighted average of 93.4%, a difference of 0.70%.
10th Grade Correlation Summary
| Measurement | Egyptian | Immigrants from Eastern Africa |
| Minimum | 87.3% | 76.9% |
| Maximum | 100.0% | 100.0% |
| Range | 12.7% | 23.1% |
| Mean | 95.6% | 92.6% |
| Median | 95.3% | 93.4% |
| Interquartile 25% (IQ1) | 93.9% | 90.8% |
| Interquartile 75% (IQ3) | 98.2% | 94.7% |
| Interquartile Range (IQR) | 4.3% | 3.9% |
| Standard Deviation (Sample) | 2.9% | 4.3% |
| Standard Deviation (Population) | 2.9% | 4.2% |
Similar Demographics by 10th Grade
Demographics Similar to Egyptians by 10th Grade
In terms of 10th grade, the demographic groups most similar to Egyptians are Kenyan (94.0%, a difference of 0.010%), Arab (94.0%, a difference of 0.020%), Ugandan (94.0%, a difference of 0.020%), Immigrants from Italy (94.0%, a difference of 0.020%), and Immigrants from Ukraine (94.0%, a difference of 0.030%).
| Demographics | Rating | Rank | 10th Grade |
| Cherokee | 84.9 /100 | #143 | Excellent 94.1% |
| Immigrants | Kazakhstan | 84.9 /100 | #144 | Excellent 94.1% |
| Immigrants | Nonimmigrants | 83.8 /100 | #145 | Excellent 94.1% |
| Chickasaw | 82.6 /100 | #146 | Excellent 94.1% |
| Immigrants | Ukraine | 81.5 /100 | #147 | Excellent 94.0% |
| Arabs | 80.9 /100 | #148 | Excellent 94.0% |
| Ugandans | 80.7 /100 | #149 | Excellent 94.0% |
| Egyptians | 79.6 /100 | #150 | Good 94.0% |
| Kenyans | 79.1 /100 | #151 | Good 94.0% |
| Immigrants | Italy | 78.0 /100 | #152 | Good 94.0% |
| Immigrants | Brazil | 75.5 /100 | #153 | Good 94.0% |
| Immigrants | Kenya | 75.3 /100 | #154 | Good 94.0% |
| Spanish | 74.9 /100 | #155 | Good 94.0% |
| Mongolians | 74.4 /100 | #156 | Good 94.0% |
| Kiowa | 73.3 /100 | #157 | Good 93.9% |
Demographics Similar to Immigrants from Eastern Africa by 10th Grade
In terms of 10th grade, the demographic groups most similar to Immigrants from Eastern Africa are Immigrants from Bahamas (93.4%, a difference of 0.010%), Immigrants from Oceania (93.4%, a difference of 0.010%), Immigrants from Asia (93.4%, a difference of 0.020%), Immigrants from Zaire (93.4%, a difference of 0.030%), and Cajun (93.4%, a difference of 0.040%).
| Demographics | Rating | Rank | 10th Grade |
| Immigrants | Chile | 18.8 /100 | #209 | Poor 93.4% |
| Indians (Asian) | 17.6 /100 | #210 | Poor 93.4% |
| Cajuns | 16.9 /100 | #211 | Poor 93.4% |
| Immigrants | Zaire | 16.7 /100 | #212 | Poor 93.4% |
| Immigrants | Asia | 15.7 /100 | #213 | Poor 93.4% |
| Immigrants | Bahamas | 15.2 /100 | #214 | Poor 93.4% |
| Immigrants | Oceania | 15.1 /100 | #215 | Poor 93.4% |
| Immigrants | Eastern Africa | 14.7 /100 | #216 | Poor 93.4% |
| Portuguese | 12.1 /100 | #217 | Poor 93.3% |
| Immigrants | Liberia | 10.2 /100 | #218 | Poor 93.3% |
| Seminole | 10.2 /100 | #219 | Poor 93.3% |
| Tongans | 9.5 /100 | #220 | Tragic 93.3% |
| Immigrants | Southern Europe | 8.9 /100 | #221 | Tragic 93.2% |
| Ethiopians | 7.9 /100 | #222 | Tragic 93.2% |
| Immigrants | Sierra Leone | 7.6 /100 | #223 | Tragic 93.2% |