Paiute vs Immigrants from Eastern Africa Receiving Food Stamps
COMPARE
Paiute
Immigrants from Eastern Africa
Receiving Food Stamps
Receiving Food Stamps Comparison
Paiute
Immigrants from Eastern Africa
14.3%
RECEIVING FOOD STAMPS
0.2/ 100
METRIC RATING
262nd/ 347
METRIC RANK
11.6%
RECEIVING FOOD STAMPS
58.3/ 100
METRIC RATING
169th/ 347
METRIC RANK
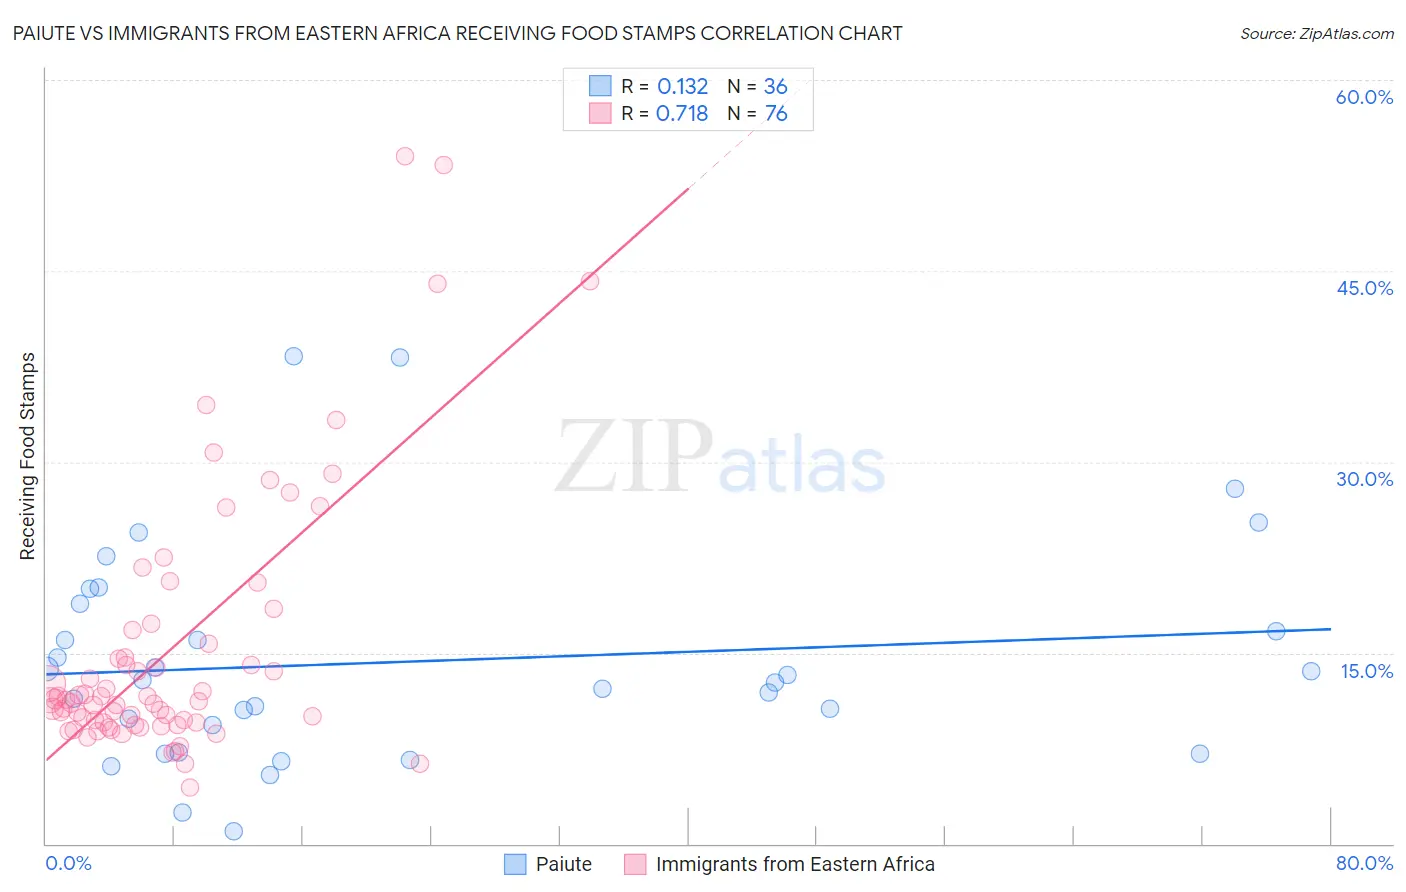
Paiute vs Immigrants from Eastern Africa Receiving Food Stamps Correlation Chart
The statistical analysis conducted on geographies consisting of 58,390,184 people shows a poor positive correlation between the proportion of Paiute and percentage of population receiving government assistance and/or food stamps in the United States with a correlation coefficient (R) of 0.132 and weighted average of 14.3%. Similarly, the statistical analysis conducted on geographies consisting of 354,350,740 people shows a strong positive correlation between the proportion of Immigrants from Eastern Africa and percentage of population receiving government assistance and/or food stamps in the United States with a correlation coefficient (R) of 0.718 and weighted average of 11.6%, a difference of 22.9%.
Receiving Food Stamps Correlation Summary
| Measurement | Paiute | Immigrants from Eastern Africa |
| Minimum | 1.0% | 4.4% |
| Maximum | 38.3% | 54.0% |
| Range | 37.3% | 49.6% |
| Mean | 14.3% | 15.4% |
| Median | 12.8% | 11.3% |
| Interquartile 25% (IQ1) | 8.2% | 9.5% |
| Interquartile 75% (IQ3) | 17.8% | 16.2% |
| Interquartile Range (IQR) | 9.6% | 6.7% |
| Standard Deviation (Sample) | 8.6% | 10.4% |
| Standard Deviation (Population) | 8.5% | 10.3% |
Similar Demographics by Receiving Food Stamps
Demographics Similar to Paiute by Receiving Food Stamps
In terms of receiving food stamps, the demographic groups most similar to Paiute are Immigrants from Portugal (14.3%, a difference of 0.0%), Immigrants from Uzbekistan (14.3%, a difference of 0.10%), Blackfeet (14.3%, a difference of 0.15%), Cheyenne (14.3%, a difference of 0.23%), and Dutch West Indian (14.3%, a difference of 0.45%).
| Demographics | Rating | Rank | Receiving Food Stamps |
| Sub-Saharan Africans | 0.3 /100 | #255 | Tragic 14.1% |
| Japanese | 0.3 /100 | #256 | Tragic 14.1% |
| Arapaho | 0.3 /100 | #257 | Tragic 14.1% |
| Immigrants | Ghana | 0.3 /100 | #258 | Tragic 14.1% |
| Creek | 0.3 /100 | #259 | Tragic 14.1% |
| Central Americans | 0.3 /100 | #260 | Tragic 14.1% |
| Immigrants | Congo | 0.3 /100 | #261 | Tragic 14.1% |
| Paiute | 0.2 /100 | #262 | Tragic 14.3% |
| Immigrants | Portugal | 0.2 /100 | #263 | Tragic 14.3% |
| Immigrants | Uzbekistan | 0.2 /100 | #264 | Tragic 14.3% |
| Blackfeet | 0.2 /100 | #265 | Tragic 14.3% |
| Cheyenne | 0.2 /100 | #266 | Tragic 14.3% |
| Dutch West Indians | 0.2 /100 | #267 | Tragic 14.3% |
| Guatemalans | 0.1 /100 | #268 | Tragic 14.4% |
| Nepalese | 0.1 /100 | #269 | Tragic 14.6% |
Demographics Similar to Immigrants from Eastern Africa by Receiving Food Stamps
In terms of receiving food stamps, the demographic groups most similar to Immigrants from Eastern Africa are Costa Rican (11.6%, a difference of 0.060%), Tlingit-Haida (11.6%, a difference of 0.12%), Kenyan (11.6%, a difference of 0.28%), Immigrants from Western Asia (11.6%, a difference of 0.28%), and Guamanian/Chamorro (11.7%, a difference of 0.60%).
| Demographics | Rating | Rank | Receiving Food Stamps |
| Alsatians | 68.0 /100 | #162 | Good 11.4% |
| Immigrants | Southern Europe | 65.8 /100 | #163 | Good 11.5% |
| Immigrants | Chile | 65.0 /100 | #164 | Good 11.5% |
| Arabs | 64.7 /100 | #165 | Good 11.5% |
| Immigrants | Belarus | 62.8 /100 | #166 | Good 11.5% |
| Kenyans | 60.2 /100 | #167 | Good 11.6% |
| Tlingit-Haida | 59.1 /100 | #168 | Average 11.6% |
| Immigrants | Eastern Africa | 58.3 /100 | #169 | Average 11.6% |
| Costa Ricans | 57.9 /100 | #170 | Average 11.6% |
| Immigrants | Western Asia | 56.4 /100 | #171 | Average 11.6% |
| Guamanians/Chamorros | 54.2 /100 | #172 | Average 11.7% |
| Immigrants | Syria | 53.4 /100 | #173 | Average 11.7% |
| Immigrants | Eritrea | 50.0 /100 | #174 | Average 11.7% |
| Osage | 49.8 /100 | #175 | Average 11.7% |
| Peruvians | 49.3 /100 | #176 | Average 11.7% |