Shoshone vs Immigrants from Eastern Africa 10th Grade
COMPARE
Shoshone
Immigrants from Eastern Africa
10th Grade
10th Grade Comparison
Shoshone
Immigrants from Eastern Africa
94.2%
10TH GRADE
90.8/ 100
METRIC RATING
136th/ 347
METRIC RANK
93.4%
10TH GRADE
14.7/ 100
METRIC RATING
216th/ 347
METRIC RANK
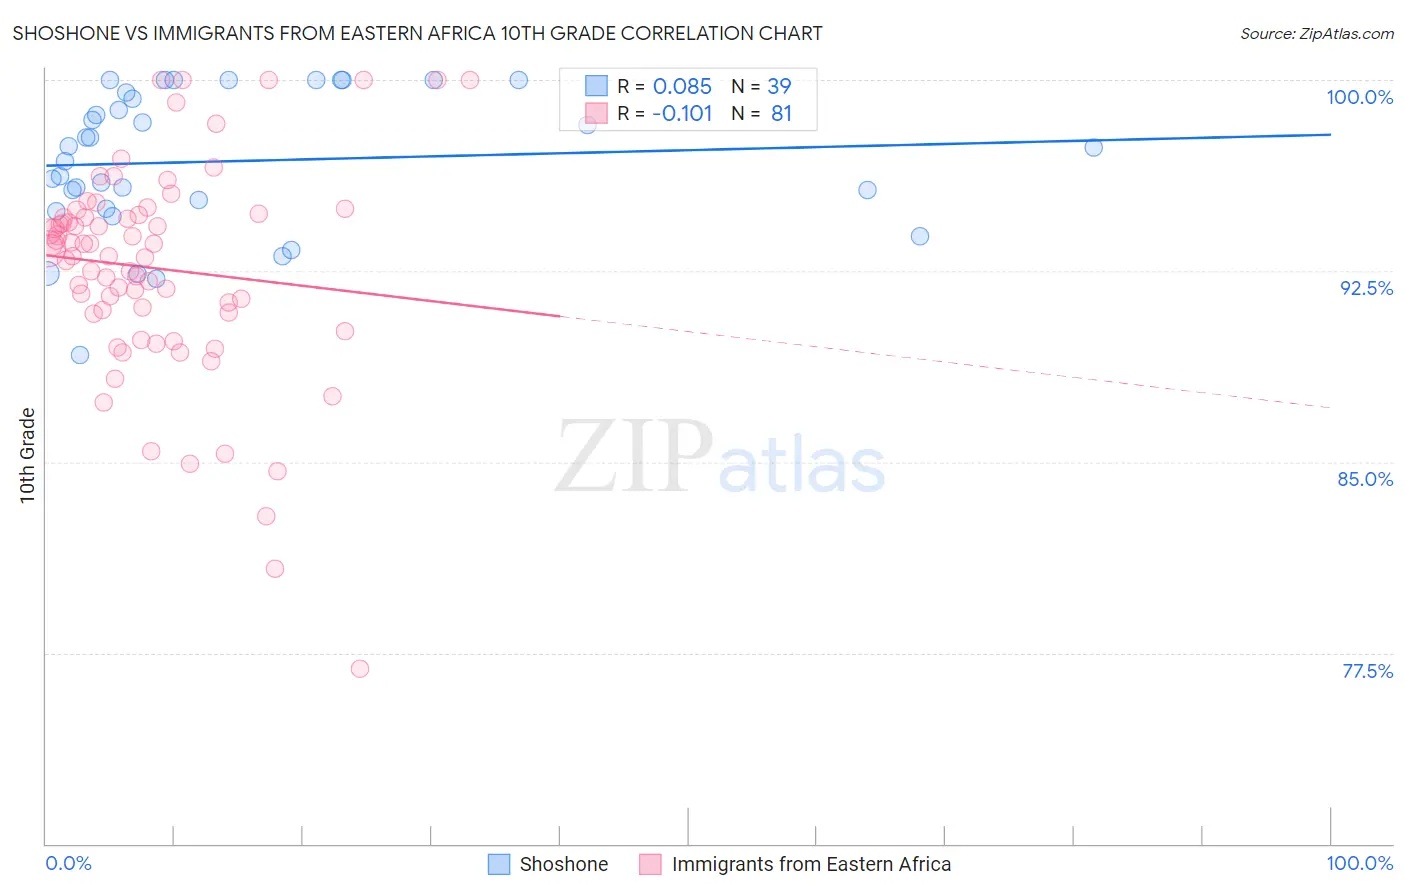
Shoshone vs Immigrants from Eastern Africa 10th Grade Correlation Chart
The statistical analysis conducted on geographies consisting of 66,625,086 people shows a slight positive correlation between the proportion of Shoshone and percentage of population with at least 10th grade education in the United States with a correlation coefficient (R) of 0.085 and weighted average of 94.2%. Similarly, the statistical analysis conducted on geographies consisting of 355,144,184 people shows a poor negative correlation between the proportion of Immigrants from Eastern Africa and percentage of population with at least 10th grade education in the United States with a correlation coefficient (R) of -0.101 and weighted average of 93.4%, a difference of 0.91%.
10th Grade Correlation Summary
| Measurement | Shoshone | Immigrants from Eastern Africa |
| Minimum | 89.2% | 76.9% |
| Maximum | 100.0% | 100.0% |
| Range | 10.8% | 23.1% |
| Mean | 96.8% | 92.6% |
| Median | 97.3% | 93.4% |
| Interquartile 25% (IQ1) | 94.9% | 90.8% |
| Interquartile 75% (IQ3) | 99.5% | 94.7% |
| Interquartile Range (IQR) | 4.6% | 3.9% |
| Standard Deviation (Sample) | 2.8% | 4.3% |
| Standard Deviation (Population) | 2.7% | 4.2% |
Similar Demographics by 10th Grade
Demographics Similar to Shoshone by 10th Grade
In terms of 10th grade, the demographic groups most similar to Shoshone are Immigrants from Korea (94.2%, a difference of 0.010%), Arapaho (94.2%, a difference of 0.010%), Immigrants from Sri Lanka (94.2%, a difference of 0.020%), Creek (94.2%, a difference of 0.030%), and Osage (94.2%, a difference of 0.030%).
| Demographics | Rating | Rank | 10th Grade |
| Iroquois | 92.8 /100 | #129 | Exceptional 94.3% |
| Immigrants | Greece | 92.7 /100 | #130 | Exceptional 94.3% |
| Immigrants | Eastern Europe | 92.5 /100 | #131 | Exceptional 94.3% |
| Immigrants | Russia | 92.4 /100 | #132 | Exceptional 94.3% |
| Creek | 91.9 /100 | #133 | Exceptional 94.2% |
| Osage | 91.7 /100 | #134 | Exceptional 94.2% |
| Immigrants | Korea | 91.3 /100 | #135 | Exceptional 94.2% |
| Shoshone | 90.8 /100 | #136 | Exceptional 94.2% |
| Arapaho | 90.5 /100 | #137 | Exceptional 94.2% |
| Immigrants | Sri Lanka | 89.9 /100 | #138 | Excellent 94.2% |
| Immigrants | Bosnia and Herzegovina | 89.4 /100 | #139 | Excellent 94.2% |
| Immigrants | Jordan | 87.6 /100 | #140 | Excellent 94.1% |
| Hmong | 86.6 /100 | #141 | Excellent 94.1% |
| Albanians | 86.5 /100 | #142 | Excellent 94.1% |
| Cherokee | 84.9 /100 | #143 | Excellent 94.1% |
Demographics Similar to Immigrants from Eastern Africa by 10th Grade
In terms of 10th grade, the demographic groups most similar to Immigrants from Eastern Africa are Immigrants from Bahamas (93.4%, a difference of 0.010%), Immigrants from Oceania (93.4%, a difference of 0.010%), Immigrants from Asia (93.4%, a difference of 0.020%), Immigrants from Zaire (93.4%, a difference of 0.030%), and Cajun (93.4%, a difference of 0.040%).
| Demographics | Rating | Rank | 10th Grade |
| Immigrants | Chile | 18.8 /100 | #209 | Poor 93.4% |
| Indians (Asian) | 17.6 /100 | #210 | Poor 93.4% |
| Cajuns | 16.9 /100 | #211 | Poor 93.4% |
| Immigrants | Zaire | 16.7 /100 | #212 | Poor 93.4% |
| Immigrants | Asia | 15.7 /100 | #213 | Poor 93.4% |
| Immigrants | Bahamas | 15.2 /100 | #214 | Poor 93.4% |
| Immigrants | Oceania | 15.1 /100 | #215 | Poor 93.4% |
| Immigrants | Eastern Africa | 14.7 /100 | #216 | Poor 93.4% |
| Portuguese | 12.1 /100 | #217 | Poor 93.3% |
| Immigrants | Liberia | 10.2 /100 | #218 | Poor 93.3% |
| Seminole | 10.2 /100 | #219 | Poor 93.3% |
| Tongans | 9.5 /100 | #220 | Tragic 93.3% |
| Immigrants | Southern Europe | 8.9 /100 | #221 | Tragic 93.2% |
| Ethiopians | 7.9 /100 | #222 | Tragic 93.2% |
| Immigrants | Sierra Leone | 7.6 /100 | #223 | Tragic 93.2% |