Paiute vs Sudanese College, Under 1 year
COMPARE
Paiute
Sudanese
College, Under 1 year
College, Under 1 year Comparison
Paiute
Sudanese
59.6%
COLLEGE, UNDER 1 YEAR
0.0/ 100
METRIC RATING
285th/ 347
METRIC RANK
66.2%
COLLEGE, UNDER 1 YEAR
74.1/ 100
METRIC RATING
152nd/ 347
METRIC RANK
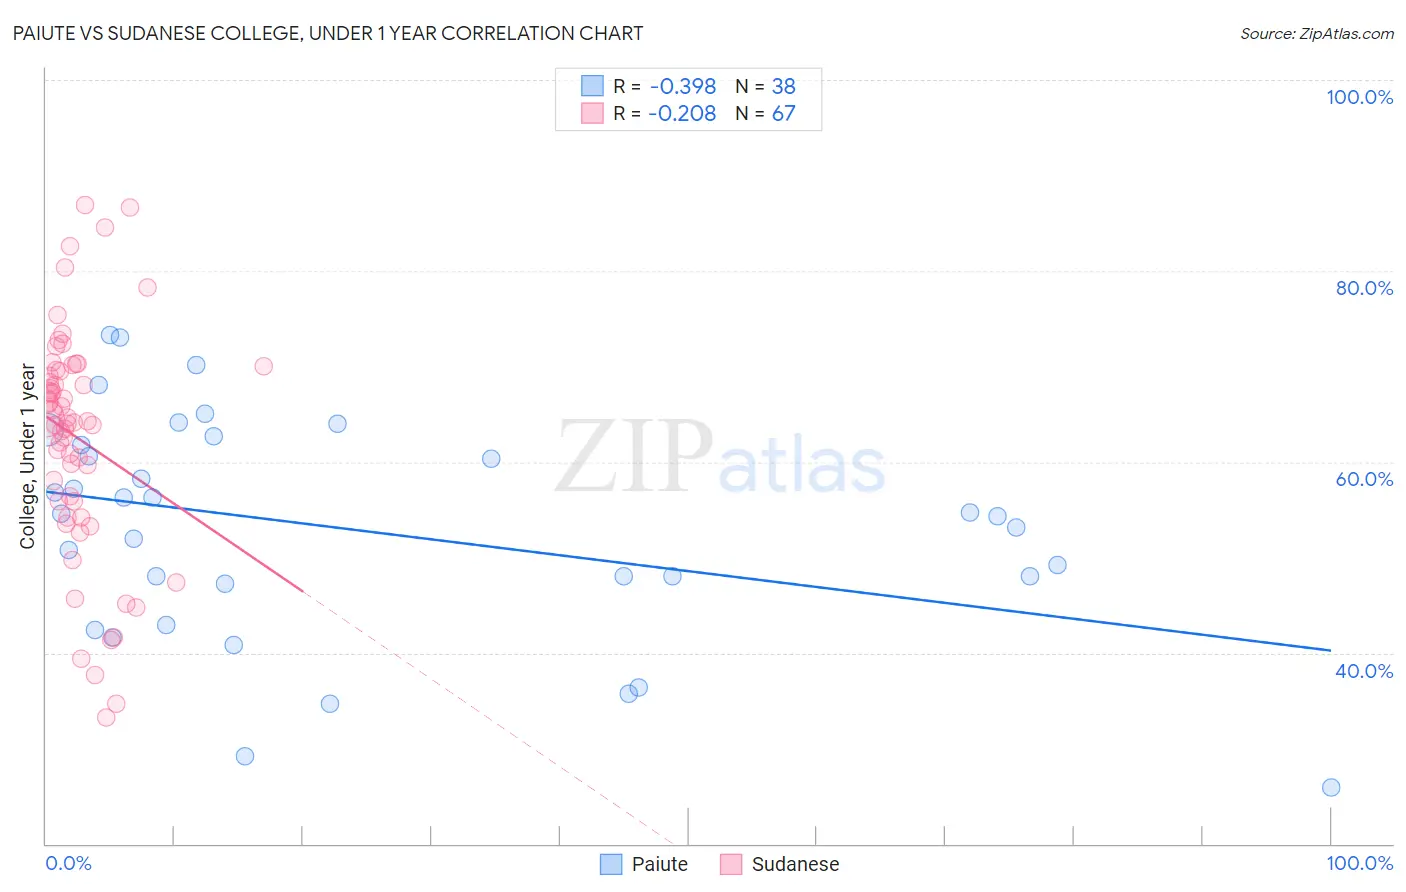
Paiute vs Sudanese College, Under 1 year Correlation Chart
The statistical analysis conducted on geographies consisting of 58,404,248 people shows a mild negative correlation between the proportion of Paiute and percentage of population with at least college, under 1 year education in the United States with a correlation coefficient (R) of -0.398 and weighted average of 59.6%. Similarly, the statistical analysis conducted on geographies consisting of 110,147,273 people shows a weak negative correlation between the proportion of Sudanese and percentage of population with at least college, under 1 year education in the United States with a correlation coefficient (R) of -0.208 and weighted average of 66.2%, a difference of 11.0%.
College, Under 1 year Correlation Summary
| Measurement | Paiute | Sudanese |
| Minimum | 25.9% | 33.2% |
| Maximum | 73.3% | 86.9% |
| Range | 47.4% | 53.7% |
| Mean | 52.9% | 62.5% |
| Median | 54.4% | 64.3% |
| Interquartile 25% (IQ1) | 47.3% | 55.9% |
| Interquartile 75% (IQ3) | 61.8% | 69.7% |
| Interquartile Range (IQR) | 14.5% | 13.8% |
| Standard Deviation (Sample) | 11.7% | 12.0% |
| Standard Deviation (Population) | 11.5% | 11.9% |
Similar Demographics by College, Under 1 year
Demographics Similar to Paiute by College, Under 1 year
In terms of college, under 1 year, the demographic groups most similar to Paiute are Immigrants from St. Vincent and the Grenadines (59.6%, a difference of 0.010%), Immigrants from Jamaica (59.7%, a difference of 0.12%), British West Indian (59.5%, a difference of 0.14%), Sioux (59.4%, a difference of 0.31%), and Black/African American (59.4%, a difference of 0.41%).
| Demographics | Rating | Rank | College, Under 1 year |
| Yaqui | 0.1 /100 | #278 | Tragic 60.2% |
| Ute | 0.1 /100 | #279 | Tragic 60.2% |
| Crow | 0.1 /100 | #280 | Tragic 60.2% |
| Cherokee | 0.1 /100 | #281 | Tragic 60.1% |
| Belizeans | 0.1 /100 | #282 | Tragic 60.1% |
| Immigrants | Jamaica | 0.0 /100 | #283 | Tragic 59.7% |
| Immigrants | St. Vincent and the Grenadines | 0.0 /100 | #284 | Tragic 59.6% |
| Paiute | 0.0 /100 | #285 | Tragic 59.6% |
| British West Indians | 0.0 /100 | #286 | Tragic 59.5% |
| Sioux | 0.0 /100 | #287 | Tragic 59.4% |
| Blacks/African Americans | 0.0 /100 | #288 | Tragic 59.4% |
| Choctaw | 0.0 /100 | #289 | Tragic 59.3% |
| Ecuadorians | 0.0 /100 | #290 | Tragic 59.3% |
| Creek | 0.0 /100 | #291 | Tragic 59.3% |
| Nicaraguans | 0.0 /100 | #292 | Tragic 59.2% |
Demographics Similar to Sudanese by College, Under 1 year
In terms of college, under 1 year, the demographic groups most similar to Sudanese are Belgian (66.2%, a difference of 0.020%), Immigrants from Sudan (66.2%, a difference of 0.11%), Immigrants from Eritrea (66.1%, a difference of 0.12%), Immigrants from Iraq (66.3%, a difference of 0.18%), and Irish (66.0%, a difference of 0.21%).
| Demographics | Rating | Rank | College, Under 1 year |
| Immigrants | Kenya | 81.8 /100 | #145 | Excellent 66.5% |
| Kenyans | 81.7 /100 | #146 | Excellent 66.5% |
| Immigrants | Morocco | 81.7 /100 | #147 | Excellent 66.5% |
| Taiwanese | 78.6 /100 | #148 | Good 66.4% |
| Immigrants | Venezuela | 77.9 /100 | #149 | Good 66.3% |
| Immigrants | Iraq | 77.1 /100 | #150 | Good 66.3% |
| Immigrants | Sudan | 76.0 /100 | #151 | Good 66.2% |
| Sudanese | 74.1 /100 | #152 | Good 66.2% |
| Belgians | 73.7 /100 | #153 | Good 66.2% |
| Immigrants | Eritrea | 71.9 /100 | #154 | Good 66.1% |
| Irish | 70.3 /100 | #155 | Good 66.0% |
| Welsh | 69.9 /100 | #156 | Good 66.0% |
| Sierra Leoneans | 67.8 /100 | #157 | Good 66.0% |
| Celtics | 67.3 /100 | #158 | Good 65.9% |
| Tlingit-Haida | 66.4 /100 | #159 | Good 65.9% |