Immigrants from Kenya vs Celtic College, 1 year or more
COMPARE
Immigrants from Kenya
Celtic
College, 1 year or more
College, 1 year or more Comparison
Immigrants from Kenya
Celtics
60.5%
COLLEGE, 1 YEAR OR MORE
79.1/ 100
METRIC RATING
147th/ 347
METRIC RANK
59.4%
COLLEGE, 1 YEAR OR MORE
50.0/ 100
METRIC RATING
174th/ 347
METRIC RANK
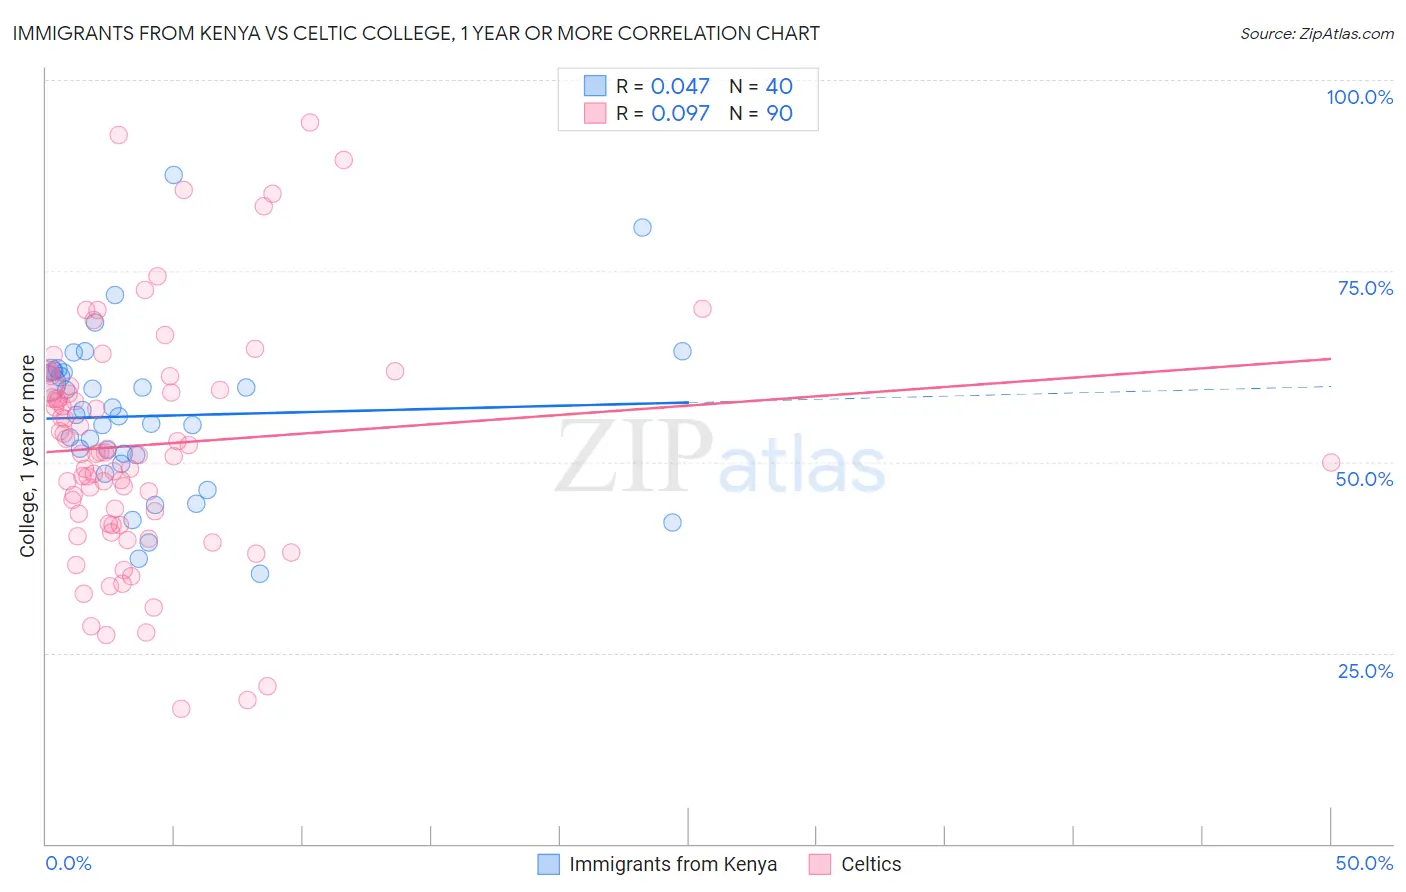
Immigrants from Kenya vs Celtic College, 1 year or more Correlation Chart
The statistical analysis conducted on geographies consisting of 218,085,582 people shows no correlation between the proportion of Immigrants from Kenya and percentage of population with at least college, 1 year or more education in the United States with a correlation coefficient (R) of 0.047 and weighted average of 60.5%. Similarly, the statistical analysis conducted on geographies consisting of 168,877,347 people shows a slight positive correlation between the proportion of Celtics and percentage of population with at least college, 1 year or more education in the United States with a correlation coefficient (R) of 0.097 and weighted average of 59.4%, a difference of 1.8%.
College, 1 year or more Correlation Summary
| Measurement | Immigrants from Kenya | Celtic |
| Minimum | 35.4% | 17.6% |
| Maximum | 87.6% | 94.4% |
| Range | 52.2% | 76.8% |
| Mean | 56.0% | 52.2% |
| Median | 56.0% | 51.2% |
| Interquartile 25% (IQ1) | 50.4% | 41.8% |
| Interquartile 75% (IQ3) | 61.8% | 59.9% |
| Interquartile Range (IQR) | 11.4% | 18.0% |
| Standard Deviation (Sample) | 10.7% | 15.4% |
| Standard Deviation (Population) | 10.6% | 15.4% |
Similar Demographics by College, 1 year or more
Demographics Similar to Immigrants from Kenya by College, 1 year or more
In terms of college, 1 year or more, the demographic groups most similar to Immigrants from Kenya are Kenyan (60.5%, a difference of 0.010%), Brazilian (60.5%, a difference of 0.010%), Scottish (60.5%, a difference of 0.090%), Immigrants from Sudan (60.4%, a difference of 0.10%), and Albanian (60.4%, a difference of 0.10%).
| Demographics | Rating | Rank | College, 1 year or more |
| Iraqis | 83.3 /100 | #140 | Excellent 60.7% |
| Immigrants | Afghanistan | 83.1 /100 | #141 | Excellent 60.7% |
| Poles | 82.8 /100 | #142 | Excellent 60.7% |
| Canadians | 82.7 /100 | #143 | Excellent 60.6% |
| Czechs | 81.9 /100 | #144 | Excellent 60.6% |
| Slavs | 81.1 /100 | #145 | Excellent 60.6% |
| Scottish | 80.2 /100 | #146 | Excellent 60.5% |
| Immigrants | Kenya | 79.1 /100 | #147 | Good 60.5% |
| Kenyans | 79.0 /100 | #148 | Good 60.5% |
| Brazilians | 79.0 /100 | #149 | Good 60.5% |
| Immigrants | Sudan | 77.8 /100 | #150 | Good 60.4% |
| Albanians | 77.8 /100 | #151 | Good 60.4% |
| Immigrants | Germany | 76.1 /100 | #152 | Good 60.3% |
| Sierra Leoneans | 74.1 /100 | #153 | Good 60.2% |
| Sudanese | 73.0 /100 | #154 | Good 60.2% |
Demographics Similar to Celtics by College, 1 year or more
In terms of college, 1 year or more, the demographic groups most similar to Celtics are Sri Lankan (59.4%, a difference of 0.050%), Immigrants from Oceania (59.4%, a difference of 0.060%), Immigrants from Poland (59.4%, a difference of 0.060%), Tlingit-Haida (59.4%, a difference of 0.080%), and Czechoslovakian (59.4%, a difference of 0.090%).
| Demographics | Rating | Rank | College, 1 year or more |
| Immigrants | North Macedonia | 53.1 /100 | #167 | Average 59.5% |
| Hungarians | 52.9 /100 | #168 | Average 59.5% |
| Immigrants | Southern Europe | 52.7 /100 | #169 | Average 59.5% |
| Welsh | 52.4 /100 | #170 | Average 59.5% |
| Immigrants | Albania | 52.3 /100 | #171 | Average 59.5% |
| Immigrants | Sierra Leone | 52.2 /100 | #172 | Average 59.5% |
| Immigrants | Oceania | 51.2 /100 | #173 | Average 59.4% |
| Celtics | 50.0 /100 | #174 | Average 59.4% |
| Sri Lankans | 49.0 /100 | #175 | Average 59.4% |
| Immigrants | Poland | 48.9 /100 | #176 | Average 59.4% |
| Tlingit-Haida | 48.4 /100 | #177 | Average 59.4% |
| Czechoslovakians | 48.3 /100 | #178 | Average 59.4% |
| Bermudans | 46.6 /100 | #179 | Average 59.3% |
| Yugoslavians | 44.1 /100 | #180 | Average 59.2% |
| Swiss | 43.4 /100 | #181 | Average 59.2% |