Immigrants from Singapore vs Celtic College, 1 year or more
COMPARE
Immigrants from Singapore
Celtic
College, 1 year or more
College, 1 year or more Comparison
Immigrants from Singapore
Celtics
70.1%
COLLEGE, 1 YEAR OR MORE
100.0/ 100
METRIC RATING
2nd/ 347
METRIC RANK
59.4%
COLLEGE, 1 YEAR OR MORE
50.0/ 100
METRIC RATING
174th/ 347
METRIC RANK
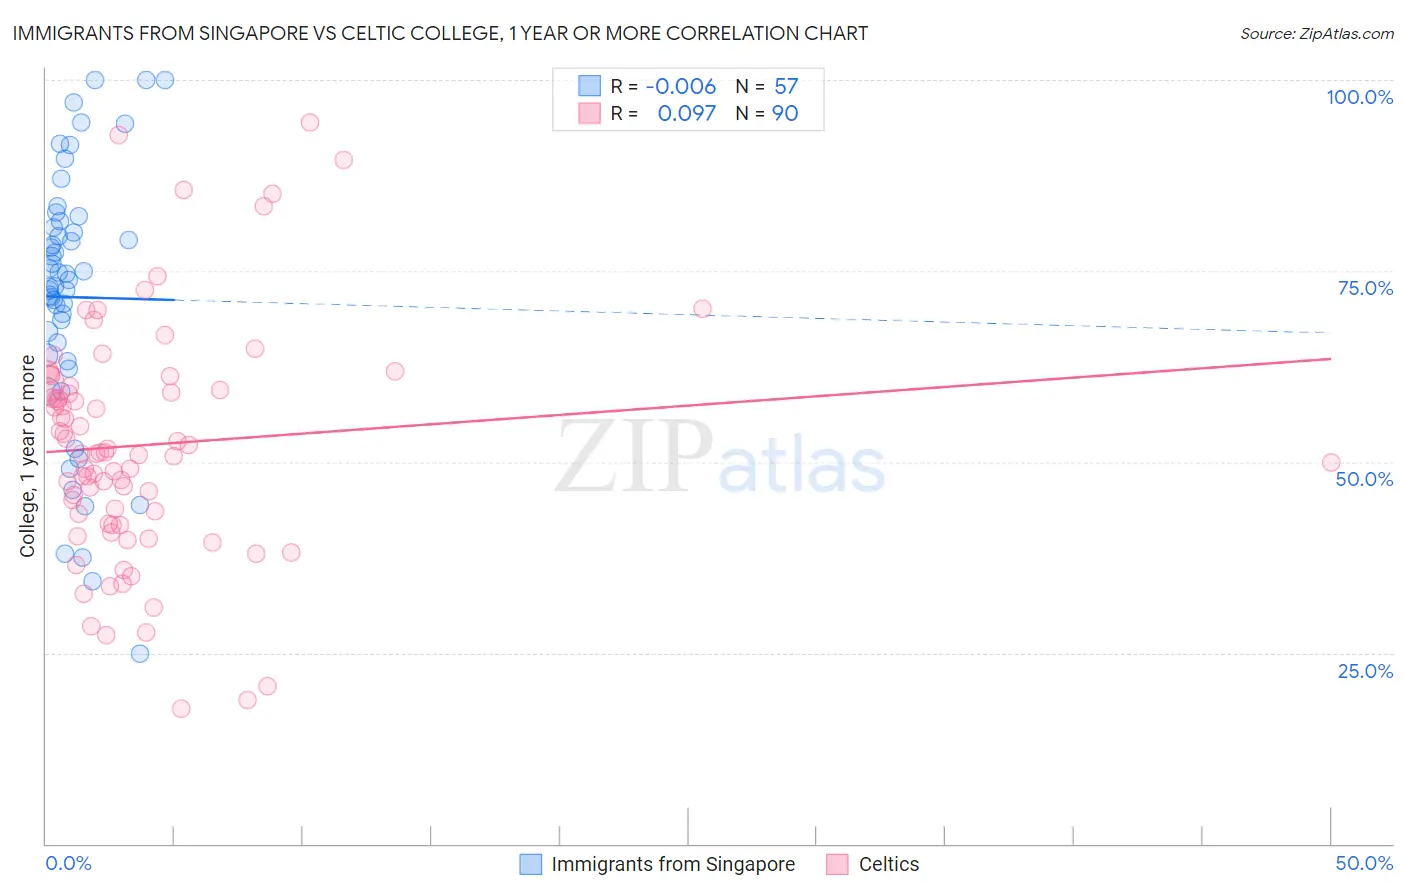
Immigrants from Singapore vs Celtic College, 1 year or more Correlation Chart
The statistical analysis conducted on geographies consisting of 137,521,700 people shows no correlation between the proportion of Immigrants from Singapore and percentage of population with at least college, 1 year or more education in the United States with a correlation coefficient (R) of -0.006 and weighted average of 70.1%. Similarly, the statistical analysis conducted on geographies consisting of 168,877,347 people shows a slight positive correlation between the proportion of Celtics and percentage of population with at least college, 1 year or more education in the United States with a correlation coefficient (R) of 0.097 and weighted average of 59.4%, a difference of 18.1%.
College, 1 year or more Correlation Summary
| Measurement | Immigrants from Singapore | Celtic |
| Minimum | 24.9% | 17.6% |
| Maximum | 100.0% | 94.4% |
| Range | 75.1% | 76.8% |
| Mean | 71.6% | 52.2% |
| Median | 73.8% | 51.2% |
| Interquartile 25% (IQ1) | 63.6% | 41.8% |
| Interquartile 75% (IQ3) | 81.1% | 59.9% |
| Interquartile Range (IQR) | 17.5% | 18.0% |
| Standard Deviation (Sample) | 17.1% | 15.4% |
| Standard Deviation (Population) | 17.0% | 15.4% |
Similar Demographics by College, 1 year or more
Demographics Similar to Immigrants from Singapore by College, 1 year or more
In terms of college, 1 year or more, the demographic groups most similar to Immigrants from Singapore are Iranian (70.0%, a difference of 0.22%), Immigrants from Taiwan (69.6%, a difference of 0.72%), Immigrants from India (69.6%, a difference of 0.72%), Immigrants from Iran (69.5%, a difference of 0.92%), and Filipino (71.0%, a difference of 1.2%).
| Demographics | Rating | Rank | College, 1 year or more |
| Filipinos | 100.0 /100 | #1 | Exceptional 71.0% |
| Immigrants | Singapore | 100.0 /100 | #2 | Exceptional 70.1% |
| Iranians | 100.0 /100 | #3 | Exceptional 70.0% |
| Immigrants | Taiwan | 100.0 /100 | #4 | Exceptional 69.6% |
| Immigrants | India | 100.0 /100 | #5 | Exceptional 69.6% |
| Immigrants | Iran | 100.0 /100 | #6 | Exceptional 69.5% |
| Okinawans | 100.0 /100 | #7 | Exceptional 69.0% |
| Thais | 100.0 /100 | #8 | Exceptional 68.6% |
| Immigrants | Israel | 100.0 /100 | #9 | Exceptional 67.8% |
| Immigrants | Australia | 100.0 /100 | #10 | Exceptional 67.7% |
| Immigrants | South Central Asia | 100.0 /100 | #11 | Exceptional 67.1% |
| Cypriots | 100.0 /100 | #12 | Exceptional 67.0% |
| Immigrants | Sweden | 100.0 /100 | #13 | Exceptional 66.8% |
| Burmese | 100.0 /100 | #14 | Exceptional 66.7% |
| Cambodians | 100.0 /100 | #15 | Exceptional 66.7% |
Demographics Similar to Celtics by College, 1 year or more
In terms of college, 1 year or more, the demographic groups most similar to Celtics are Sri Lankan (59.4%, a difference of 0.050%), Immigrants from Oceania (59.4%, a difference of 0.060%), Immigrants from Poland (59.4%, a difference of 0.060%), Tlingit-Haida (59.4%, a difference of 0.080%), and Czechoslovakian (59.4%, a difference of 0.090%).
| Demographics | Rating | Rank | College, 1 year or more |
| Immigrants | North Macedonia | 53.1 /100 | #167 | Average 59.5% |
| Hungarians | 52.9 /100 | #168 | Average 59.5% |
| Immigrants | Southern Europe | 52.7 /100 | #169 | Average 59.5% |
| Welsh | 52.4 /100 | #170 | Average 59.5% |
| Immigrants | Albania | 52.3 /100 | #171 | Average 59.5% |
| Immigrants | Sierra Leone | 52.2 /100 | #172 | Average 59.5% |
| Immigrants | Oceania | 51.2 /100 | #173 | Average 59.4% |
| Celtics | 50.0 /100 | #174 | Average 59.4% |
| Sri Lankans | 49.0 /100 | #175 | Average 59.4% |
| Immigrants | Poland | 48.9 /100 | #176 | Average 59.4% |
| Tlingit-Haida | 48.4 /100 | #177 | Average 59.4% |
| Czechoslovakians | 48.3 /100 | #178 | Average 59.4% |
| Bermudans | 46.6 /100 | #179 | Average 59.3% |
| Yugoslavians | 44.1 /100 | #180 | Average 59.2% |
| Swiss | 43.4 /100 | #181 | Average 59.2% |