Guatemalan vs Celtic College, 1 year or more
COMPARE
Guatemalan
Celtic
College, 1 year or more
College, 1 year or more Comparison
Guatemalans
Celtics
51.2%
COLLEGE, 1 YEAR OR MORE
0.0/ 100
METRIC RATING
315th/ 347
METRIC RANK
59.4%
COLLEGE, 1 YEAR OR MORE
50.0/ 100
METRIC RATING
174th/ 347
METRIC RANK
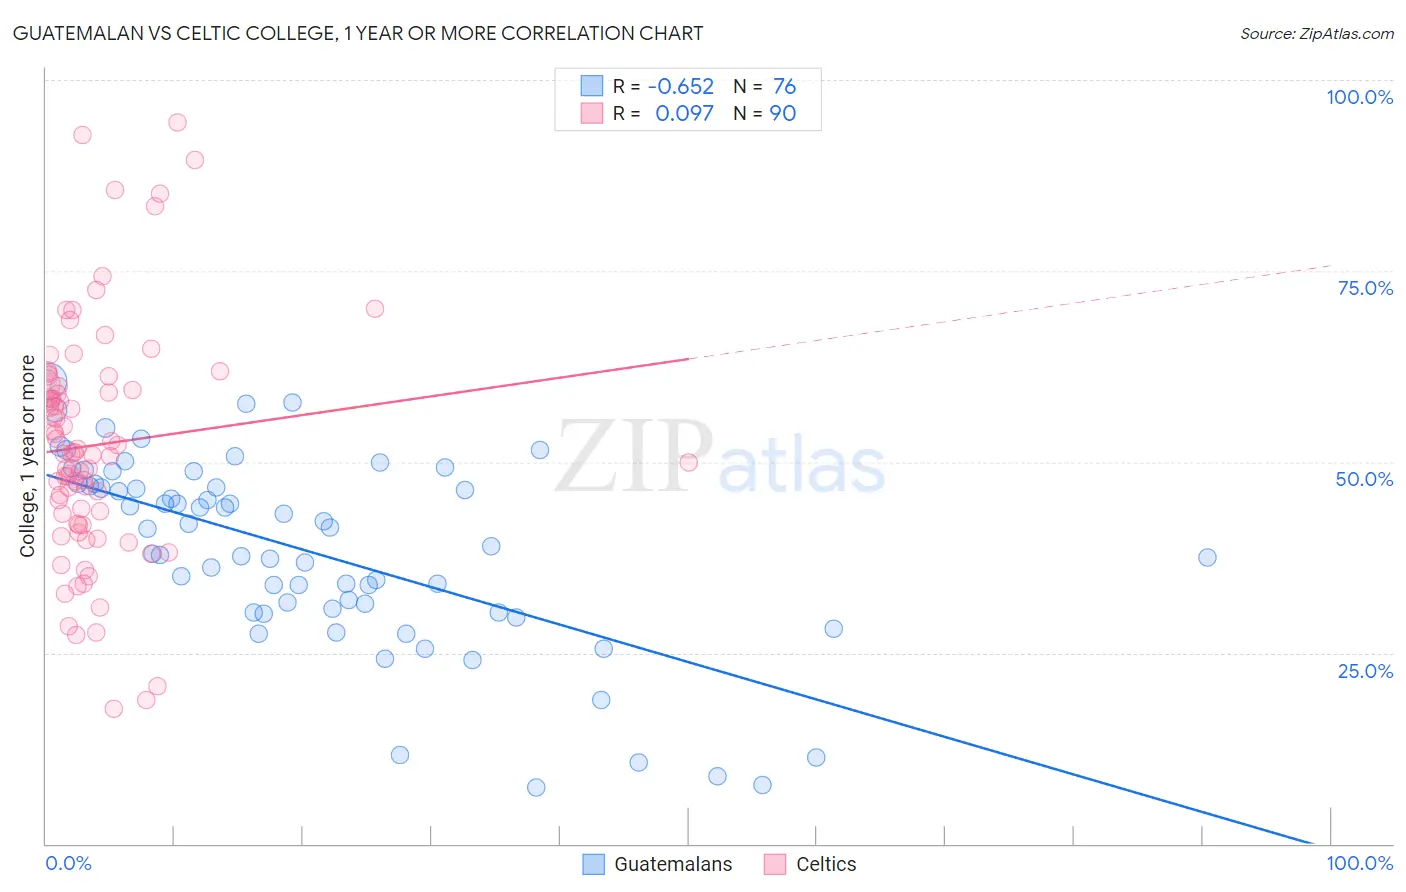
Guatemalan vs Celtic College, 1 year or more Correlation Chart
The statistical analysis conducted on geographies consisting of 409,563,742 people shows a significant negative correlation between the proportion of Guatemalans and percentage of population with at least college, 1 year or more education in the United States with a correlation coefficient (R) of -0.652 and weighted average of 51.2%. Similarly, the statistical analysis conducted on geographies consisting of 168,877,347 people shows a slight positive correlation between the proportion of Celtics and percentage of population with at least college, 1 year or more education in the United States with a correlation coefficient (R) of 0.097 and weighted average of 59.4%, a difference of 16.0%.
College, 1 year or more Correlation Summary
| Measurement | Guatemalan | Celtic |
| Minimum | 7.4% | 17.6% |
| Maximum | 60.6% | 94.4% |
| Range | 53.2% | 76.8% |
| Mean | 38.2% | 52.2% |
| Median | 40.1% | 51.2% |
| Interquartile 25% (IQ1) | 30.6% | 41.8% |
| Interquartile 75% (IQ3) | 47.0% | 59.9% |
| Interquartile Range (IQR) | 16.5% | 18.0% |
| Standard Deviation (Sample) | 12.5% | 15.4% |
| Standard Deviation (Population) | 12.4% | 15.4% |
Similar Demographics by College, 1 year or more
Demographics Similar to Guatemalans by College, 1 year or more
In terms of college, 1 year or more, the demographic groups most similar to Guatemalans are Cajun (51.2%, a difference of 0.070%), Hispanic or Latino (51.1%, a difference of 0.16%), Fijian (51.3%, a difference of 0.23%), Immigrants from Honduras (51.0%, a difference of 0.29%), and Immigrants from El Salvador (51.0%, a difference of 0.38%).
| Demographics | Rating | Rank | College, 1 year or more |
| Salvadorans | 0.0 /100 | #308 | Tragic 51.8% |
| Apache | 0.0 /100 | #309 | Tragic 51.8% |
| Hondurans | 0.0 /100 | #310 | Tragic 51.6% |
| Immigrants | Haiti | 0.0 /100 | #311 | Tragic 51.5% |
| Pueblo | 0.0 /100 | #312 | Tragic 51.5% |
| Immigrants | Caribbean | 0.0 /100 | #313 | Tragic 51.4% |
| Fijians | 0.0 /100 | #314 | Tragic 51.3% |
| Guatemalans | 0.0 /100 | #315 | Tragic 51.2% |
| Cajuns | 0.0 /100 | #316 | Tragic 51.2% |
| Hispanics or Latinos | 0.0 /100 | #317 | Tragic 51.1% |
| Immigrants | Honduras | 0.0 /100 | #318 | Tragic 51.0% |
| Immigrants | El Salvador | 0.0 /100 | #319 | Tragic 51.0% |
| Kiowa | 0.0 /100 | #320 | Tragic 51.0% |
| Hopi | 0.0 /100 | #321 | Tragic 50.9% |
| Navajo | 0.0 /100 | #322 | Tragic 50.8% |
Demographics Similar to Celtics by College, 1 year or more
In terms of college, 1 year or more, the demographic groups most similar to Celtics are Sri Lankan (59.4%, a difference of 0.050%), Immigrants from Oceania (59.4%, a difference of 0.060%), Immigrants from Poland (59.4%, a difference of 0.060%), Tlingit-Haida (59.4%, a difference of 0.080%), and Czechoslovakian (59.4%, a difference of 0.090%).
| Demographics | Rating | Rank | College, 1 year or more |
| Immigrants | North Macedonia | 53.1 /100 | #167 | Average 59.5% |
| Hungarians | 52.9 /100 | #168 | Average 59.5% |
| Immigrants | Southern Europe | 52.7 /100 | #169 | Average 59.5% |
| Welsh | 52.4 /100 | #170 | Average 59.5% |
| Immigrants | Albania | 52.3 /100 | #171 | Average 59.5% |
| Immigrants | Sierra Leone | 52.2 /100 | #172 | Average 59.5% |
| Immigrants | Oceania | 51.2 /100 | #173 | Average 59.4% |
| Celtics | 50.0 /100 | #174 | Average 59.4% |
| Sri Lankans | 49.0 /100 | #175 | Average 59.4% |
| Immigrants | Poland | 48.9 /100 | #176 | Average 59.4% |
| Tlingit-Haida | 48.4 /100 | #177 | Average 59.4% |
| Czechoslovakians | 48.3 /100 | #178 | Average 59.4% |
| Bermudans | 46.6 /100 | #179 | Average 59.3% |
| Yugoslavians | 44.1 /100 | #180 | Average 59.2% |
| Swiss | 43.4 /100 | #181 | Average 59.2% |