Osage vs Armenian 8th Grade
COMPARE
Osage
Armenian
8th Grade
8th Grade Comparison
Osage
Armenians
96.4%
8TH GRADE
98.7/ 100
METRIC RATING
97th/ 347
METRIC RANK
94.7%
8TH GRADE
0.1/ 100
METRIC RATING
278th/ 347
METRIC RANK
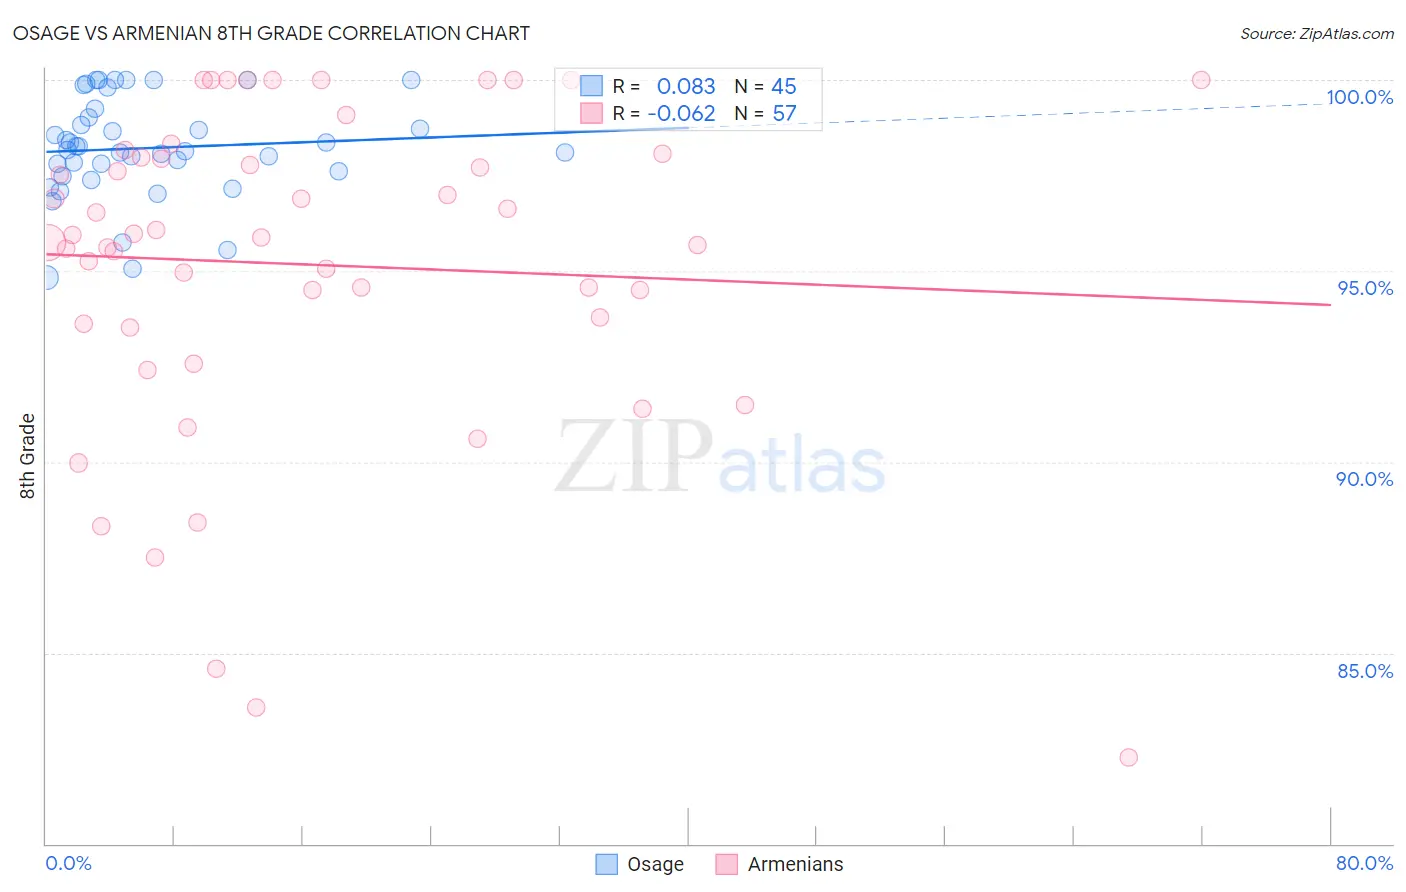
Osage vs Armenian 8th Grade Correlation Chart
The statistical analysis conducted on geographies consisting of 91,808,929 people shows a slight positive correlation between the proportion of Osage and percentage of population with at least 8th grade education in the United States with a correlation coefficient (R) of 0.083 and weighted average of 96.4%. Similarly, the statistical analysis conducted on geographies consisting of 310,954,801 people shows a slight negative correlation between the proportion of Armenians and percentage of population with at least 8th grade education in the United States with a correlation coefficient (R) of -0.062 and weighted average of 94.7%, a difference of 1.8%.
8th Grade Correlation Summary
| Measurement | Osage | Armenian |
| Minimum | 94.8% | 82.3% |
| Maximum | 100.0% | 100.0% |
| Range | 5.2% | 17.7% |
| Mean | 98.2% | 95.2% |
| Median | 98.2% | 95.9% |
| Interquartile 25% (IQ1) | 97.5% | 93.6% |
| Interquartile 75% (IQ3) | 99.1% | 98.0% |
| Interquartile Range (IQR) | 1.6% | 4.5% |
| Standard Deviation (Sample) | 1.3% | 4.3% |
| Standard Deviation (Population) | 1.3% | 4.2% |
Similar Demographics by 8th Grade
Demographics Similar to Osage by 8th Grade
In terms of 8th grade, the demographic groups most similar to Osage are Potawatomi (96.4%, a difference of 0.0%), Immigrants from Germany (96.4%, a difference of 0.0%), Cree (96.4%, a difference of 0.0%), Immigrants from Singapore (96.4%, a difference of 0.010%), and German Russian (96.4%, a difference of 0.010%).
| Demographics | Rating | Rank | 8th Grade |
| Immigrants | Sweden | 98.9 /100 | #90 | Exceptional 96.4% |
| Thais | 98.9 /100 | #91 | Exceptional 96.4% |
| Menominee | 98.9 /100 | #92 | Exceptional 96.4% |
| Immigrants | Denmark | 98.8 /100 | #93 | Exceptional 96.4% |
| Immigrants | Singapore | 98.8 /100 | #94 | Exceptional 96.4% |
| German Russians | 98.8 /100 | #95 | Exceptional 96.4% |
| Potawatomi | 98.7 /100 | #96 | Exceptional 96.4% |
| Osage | 98.7 /100 | #97 | Exceptional 96.4% |
| Immigrants | Germany | 98.7 /100 | #98 | Exceptional 96.4% |
| Cree | 98.6 /100 | #99 | Exceptional 96.4% |
| Immigrants | Czechoslovakia | 98.6 /100 | #100 | Exceptional 96.4% |
| Bhutanese | 98.2 /100 | #101 | Exceptional 96.4% |
| South Africans | 98.2 /100 | #102 | Exceptional 96.4% |
| Immigrants | Saudi Arabia | 98.0 /100 | #103 | Exceptional 96.3% |
| Kiowa | 98.0 /100 | #104 | Exceptional 96.3% |
Demographics Similar to Armenians by 8th Grade
In terms of 8th grade, the demographic groups most similar to Armenians are Immigrants from Trinidad and Tobago (94.6%, a difference of 0.010%), Barbadian (94.6%, a difference of 0.010%), Immigrants from Bolivia (94.6%, a difference of 0.020%), Taiwanese (94.7%, a difference of 0.030%), and Peruvian (94.7%, a difference of 0.060%).
| Demographics | Rating | Rank | 8th Grade |
| Immigrants | Afghanistan | 0.2 /100 | #271 | Tragic 94.8% |
| Immigrants | South America | 0.2 /100 | #272 | Tragic 94.8% |
| Immigrants | Western Africa | 0.2 /100 | #273 | Tragic 94.8% |
| Trinidadians and Tobagonians | 0.2 /100 | #274 | Tragic 94.7% |
| Immigrants | Colombia | 0.2 /100 | #275 | Tragic 94.7% |
| Peruvians | 0.1 /100 | #276 | Tragic 94.7% |
| Taiwanese | 0.1 /100 | #277 | Tragic 94.7% |
| Armenians | 0.1 /100 | #278 | Tragic 94.7% |
| Immigrants | Trinidad and Tobago | 0.1 /100 | #279 | Tragic 94.6% |
| Barbadians | 0.1 /100 | #280 | Tragic 94.6% |
| Immigrants | Bolivia | 0.1 /100 | #281 | Tragic 94.6% |
| Immigrants | Eritrea | 0.1 /100 | #282 | Tragic 94.6% |
| Immigrants | St. Vincent and the Grenadines | 0.1 /100 | #283 | Tragic 94.6% |
| Immigrants | Philippines | 0.1 /100 | #284 | Tragic 94.6% |
| Immigrants | Barbados | 0.0 /100 | #285 | Tragic 94.5% |