Osage vs Bermudan 8th Grade
COMPARE
Osage
Bermudan
8th Grade
8th Grade Comparison
Osage
Bermudans
96.4%
8TH GRADE
98.7/ 100
METRIC RATING
97th/ 347
METRIC RANK
95.8%
8TH GRADE
67.5/ 100
METRIC RATING
161st/ 347
METRIC RANK
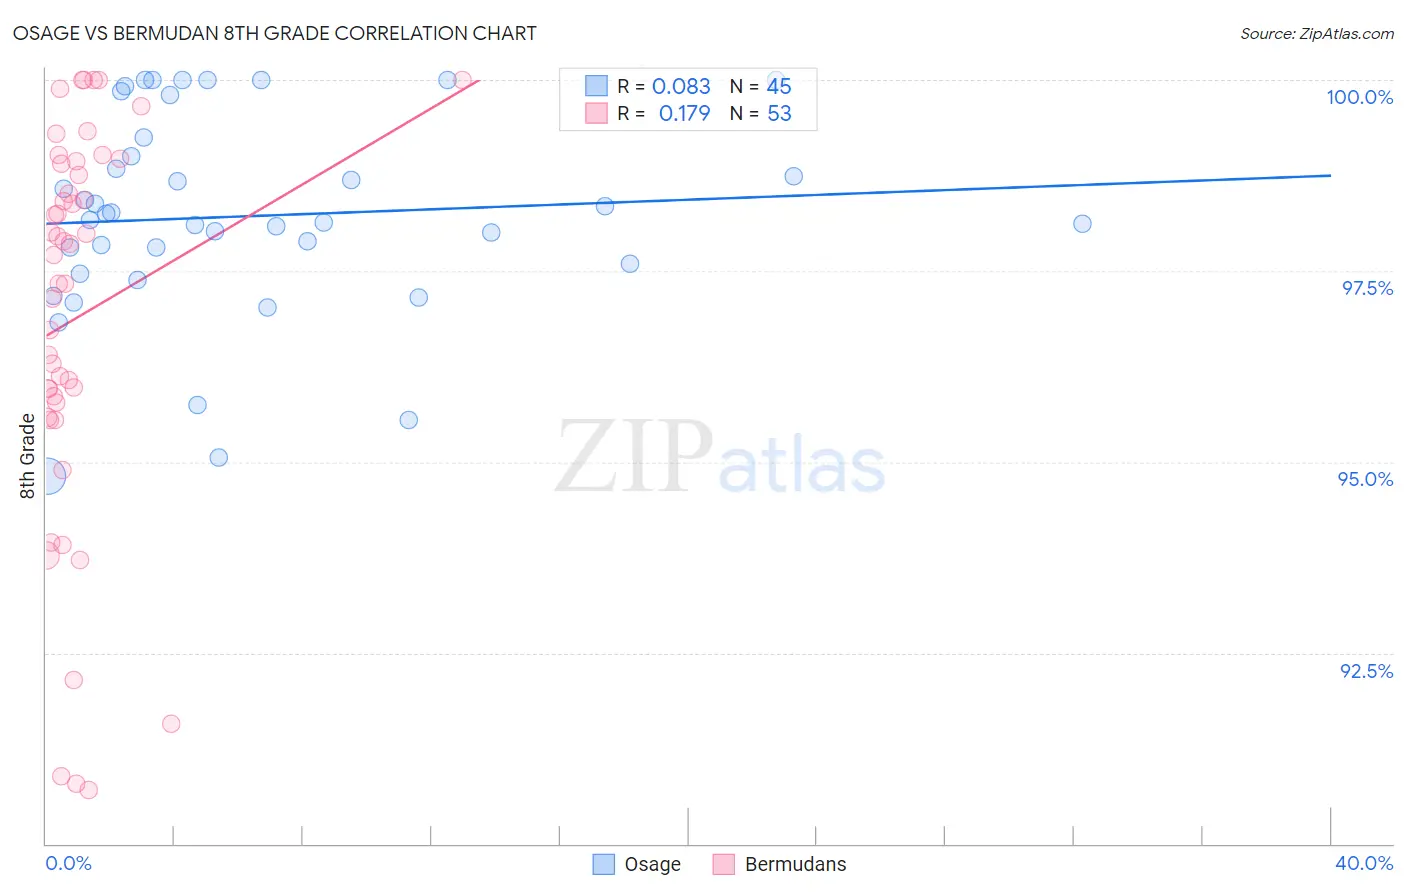
Osage vs Bermudan 8th Grade Correlation Chart
The statistical analysis conducted on geographies consisting of 91,808,929 people shows a slight positive correlation between the proportion of Osage and percentage of population with at least 8th grade education in the United States with a correlation coefficient (R) of 0.083 and weighted average of 96.4%. Similarly, the statistical analysis conducted on geographies consisting of 55,732,793 people shows a poor positive correlation between the proportion of Bermudans and percentage of population with at least 8th grade education in the United States with a correlation coefficient (R) of 0.179 and weighted average of 95.8%, a difference of 0.58%.
8th Grade Correlation Summary
| Measurement | Osage | Bermudan |
| Minimum | 94.8% | 90.7% |
| Maximum | 100.0% | 100.0% |
| Range | 5.2% | 9.3% |
| Mean | 98.2% | 96.9% |
| Median | 98.2% | 97.7% |
| Interquartile 25% (IQ1) | 97.5% | 95.7% |
| Interquartile 75% (IQ3) | 99.1% | 98.9% |
| Interquartile Range (IQR) | 1.6% | 3.2% |
| Standard Deviation (Sample) | 1.3% | 2.5% |
| Standard Deviation (Population) | 1.3% | 2.5% |
Similar Demographics by 8th Grade
Demographics Similar to Osage by 8th Grade
In terms of 8th grade, the demographic groups most similar to Osage are Potawatomi (96.4%, a difference of 0.0%), Immigrants from Germany (96.4%, a difference of 0.0%), Cree (96.4%, a difference of 0.0%), Immigrants from Singapore (96.4%, a difference of 0.010%), and German Russian (96.4%, a difference of 0.010%).
| Demographics | Rating | Rank | 8th Grade |
| Immigrants | Sweden | 98.9 /100 | #90 | Exceptional 96.4% |
| Thais | 98.9 /100 | #91 | Exceptional 96.4% |
| Menominee | 98.9 /100 | #92 | Exceptional 96.4% |
| Immigrants | Denmark | 98.8 /100 | #93 | Exceptional 96.4% |
| Immigrants | Singapore | 98.8 /100 | #94 | Exceptional 96.4% |
| German Russians | 98.8 /100 | #95 | Exceptional 96.4% |
| Potawatomi | 98.7 /100 | #96 | Exceptional 96.4% |
| Osage | 98.7 /100 | #97 | Exceptional 96.4% |
| Immigrants | Germany | 98.7 /100 | #98 | Exceptional 96.4% |
| Cree | 98.6 /100 | #99 | Exceptional 96.4% |
| Immigrants | Czechoslovakia | 98.6 /100 | #100 | Exceptional 96.4% |
| Bhutanese | 98.2 /100 | #101 | Exceptional 96.4% |
| South Africans | 98.2 /100 | #102 | Exceptional 96.4% |
| Immigrants | Saudi Arabia | 98.0 /100 | #103 | Exceptional 96.3% |
| Kiowa | 98.0 /100 | #104 | Exceptional 96.3% |
Demographics Similar to Bermudans by 8th Grade
In terms of 8th grade, the demographic groups most similar to Bermudans are Seminole (95.8%, a difference of 0.0%), Immigrants from Kenya (95.8%, a difference of 0.0%), Arab (95.9%, a difference of 0.010%), Immigrants from Kazakhstan (95.9%, a difference of 0.010%), and Immigrants from Taiwan (95.9%, a difference of 0.020%).
| Demographics | Rating | Rank | 8th Grade |
| Hopi | 79.4 /100 | #154 | Good 95.9% |
| Kenyans | 74.5 /100 | #155 | Good 95.9% |
| Ugandans | 74.1 /100 | #156 | Good 95.9% |
| Immigrants | Taiwan | 70.5 /100 | #157 | Good 95.9% |
| Arabs | 69.4 /100 | #158 | Good 95.9% |
| Immigrants | Kazakhstan | 68.4 /100 | #159 | Good 95.9% |
| Seminole | 67.7 /100 | #160 | Good 95.8% |
| Bermudans | 67.5 /100 | #161 | Good 95.8% |
| Immigrants | Kenya | 67.2 /100 | #162 | Good 95.8% |
| Immigrants | Sri Lanka | 64.1 /100 | #163 | Good 95.8% |
| Immigrants | Italy | 63.5 /100 | #164 | Good 95.8% |
| Alsatians | 61.4 /100 | #165 | Good 95.8% |
| Immigrants | Poland | 61.1 /100 | #166 | Good 95.8% |
| Spaniards | 60.0 /100 | #167 | Good 95.8% |
| Immigrants | Ukraine | 59.5 /100 | #168 | Average 95.8% |