Central American vs Immigrants from Morocco 10th Grade
COMPARE
Central American
Immigrants from Morocco
10th Grade
10th Grade Comparison
Central Americans
Immigrants from Morocco
88.4%
10TH GRADE
0.0/ 100
METRIC RATING
337th/ 347
METRIC RANK
93.5%
10TH GRADE
26.9/ 100
METRIC RATING
194th/ 347
METRIC RANK
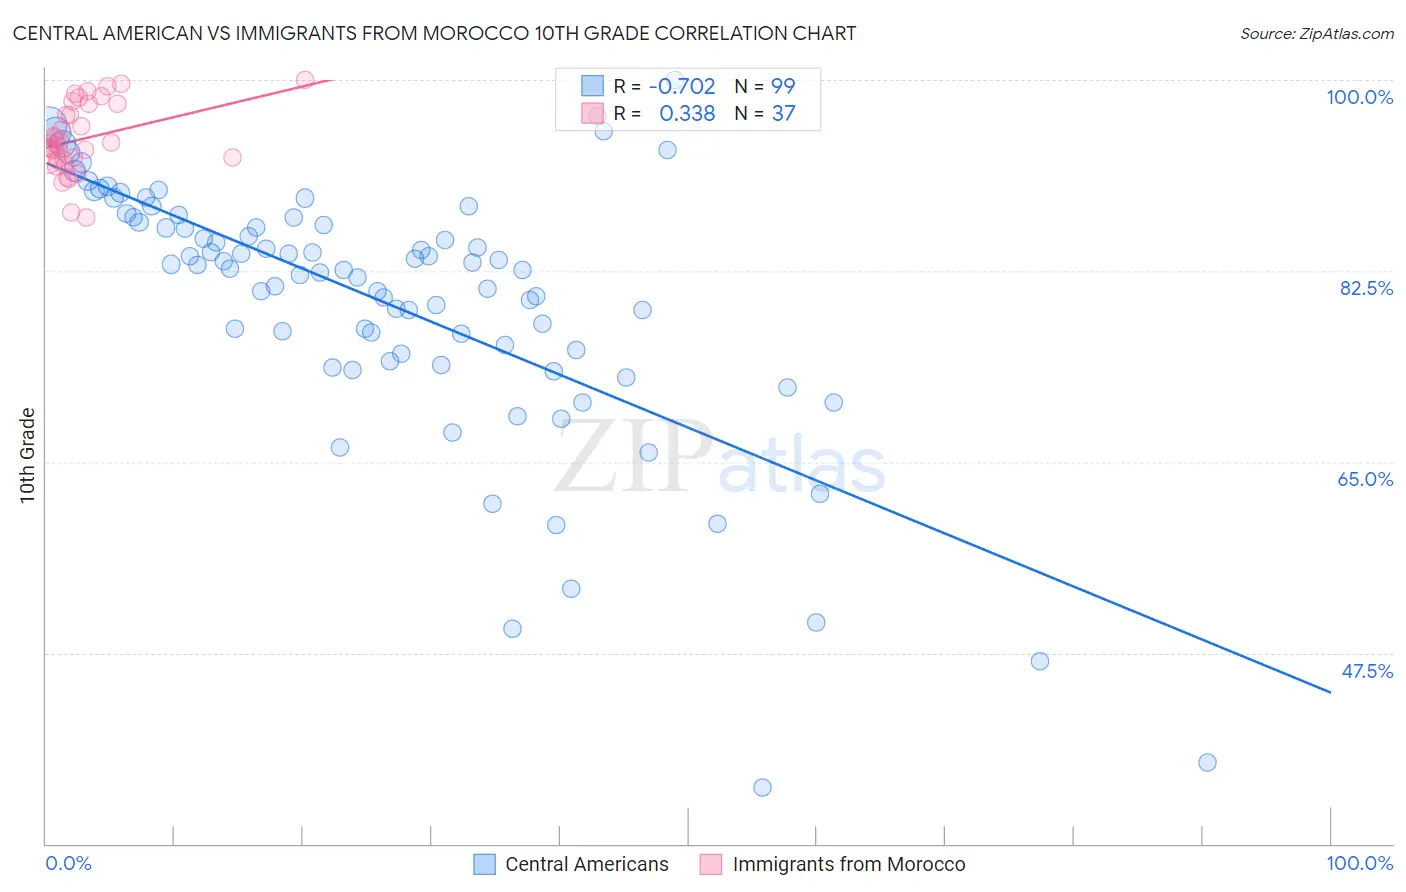
Central American vs Immigrants from Morocco 10th Grade Correlation Chart
The statistical analysis conducted on geographies consisting of 504,619,347 people shows a strong negative correlation between the proportion of Central Americans and percentage of population with at least 10th grade education in the United States with a correlation coefficient (R) of -0.702 and weighted average of 88.4%. Similarly, the statistical analysis conducted on geographies consisting of 178,912,438 people shows a mild positive correlation between the proportion of Immigrants from Morocco and percentage of population with at least 10th grade education in the United States with a correlation coefficient (R) of 0.338 and weighted average of 93.5%, a difference of 5.8%.
10th Grade Correlation Summary
| Measurement | Central American | Immigrants from Morocco |
| Minimum | 35.2% | 87.4% |
| Maximum | 100.0% | 100.0% |
| Range | 64.8% | 12.6% |
| Mean | 79.6% | 94.6% |
| Median | 82.7% | 94.0% |
| Interquartile 25% (IQ1) | 74.9% | 92.7% |
| Interquartile 75% (IQ3) | 87.4% | 97.8% |
| Interquartile Range (IQR) | 12.6% | 5.1% |
| Standard Deviation (Sample) | 12.1% | 3.2% |
| Standard Deviation (Population) | 12.1% | 3.2% |
Similar Demographics by 10th Grade
Demographics Similar to Central Americans by 10th Grade
In terms of 10th grade, the demographic groups most similar to Central Americans are Immigrants from Latin America (88.3%, a difference of 0.060%), Immigrants from Honduras (88.5%, a difference of 0.15%), Immigrants from Dominican Republic (88.7%, a difference of 0.35%), Hispanic or Latino (88.9%, a difference of 0.53%), and Guatemalan (87.9%, a difference of 0.56%).
| Demographics | Rating | Rank | 10th Grade |
| Immigrants | Yemen | 0.0 /100 | #330 | Tragic 89.1% |
| Mexican American Indians | 0.0 /100 | #331 | Tragic 89.0% |
| Immigrants | Azores | 0.0 /100 | #332 | Tragic 89.0% |
| Hondurans | 0.0 /100 | #333 | Tragic 89.0% |
| Hispanics or Latinos | 0.0 /100 | #334 | Tragic 88.9% |
| Immigrants | Dominican Republic | 0.0 /100 | #335 | Tragic 88.7% |
| Immigrants | Honduras | 0.0 /100 | #336 | Tragic 88.5% |
| Central Americans | 0.0 /100 | #337 | Tragic 88.4% |
| Immigrants | Latin America | 0.0 /100 | #338 | Tragic 88.3% |
| Guatemalans | 0.0 /100 | #339 | Tragic 87.9% |
| Mexicans | 0.0 /100 | #340 | Tragic 87.8% |
| Salvadorans | 0.0 /100 | #341 | Tragic 87.5% |
| Immigrants | Guatemala | 0.0 /100 | #342 | Tragic 87.4% |
| Yakama | 0.0 /100 | #343 | Tragic 86.9% |
| Immigrants | El Salvador | 0.0 /100 | #344 | Tragic 86.8% |
Demographics Similar to Immigrants from Morocco by 10th Grade
In terms of 10th grade, the demographic groups most similar to Immigrants from Morocco are Cheyenne (93.5%, a difference of 0.0%), Immigrants from Malaysia (93.5%, a difference of 0.010%), Panamanian (93.5%, a difference of 0.010%), Moroccan (93.5%, a difference of 0.020%), and Pueblo (93.5%, a difference of 0.040%).
| Demographics | Rating | Rank | 10th Grade |
| Liberians | 34.7 /100 | #187 | Fair 93.6% |
| Marshallese | 33.2 /100 | #188 | Fair 93.6% |
| Immigrants | Pakistan | 32.5 /100 | #189 | Fair 93.6% |
| Laotians | 32.1 /100 | #190 | Fair 93.6% |
| Yup'ik | 31.1 /100 | #191 | Fair 93.6% |
| Immigrants | Malaysia | 28.0 /100 | #192 | Fair 93.5% |
| Panamanians | 28.0 /100 | #193 | Fair 93.5% |
| Immigrants | Morocco | 26.9 /100 | #194 | Fair 93.5% |
| Cheyenne | 26.8 /100 | #195 | Fair 93.5% |
| Moroccans | 25.3 /100 | #196 | Fair 93.5% |
| Pueblo | 23.9 /100 | #197 | Fair 93.5% |
| Immigrants | Micronesia | 23.2 /100 | #198 | Fair 93.5% |
| Asians | 23.0 /100 | #199 | Fair 93.5% |
| Hopi | 22.2 /100 | #200 | Fair 93.5% |
| Hawaiians | 21.8 /100 | #201 | Fair 93.5% |