Immigrants from Middle Africa vs Immigrants from Morocco 10th Grade
COMPARE
Immigrants from Middle Africa
Immigrants from Morocco
10th Grade
10th Grade Comparison
Immigrants from Middle Africa
Immigrants from Morocco
92.9%
10TH GRADE
1.7/ 100
METRIC RATING
246th/ 347
METRIC RANK
93.5%
10TH GRADE
26.9/ 100
METRIC RATING
194th/ 347
METRIC RANK
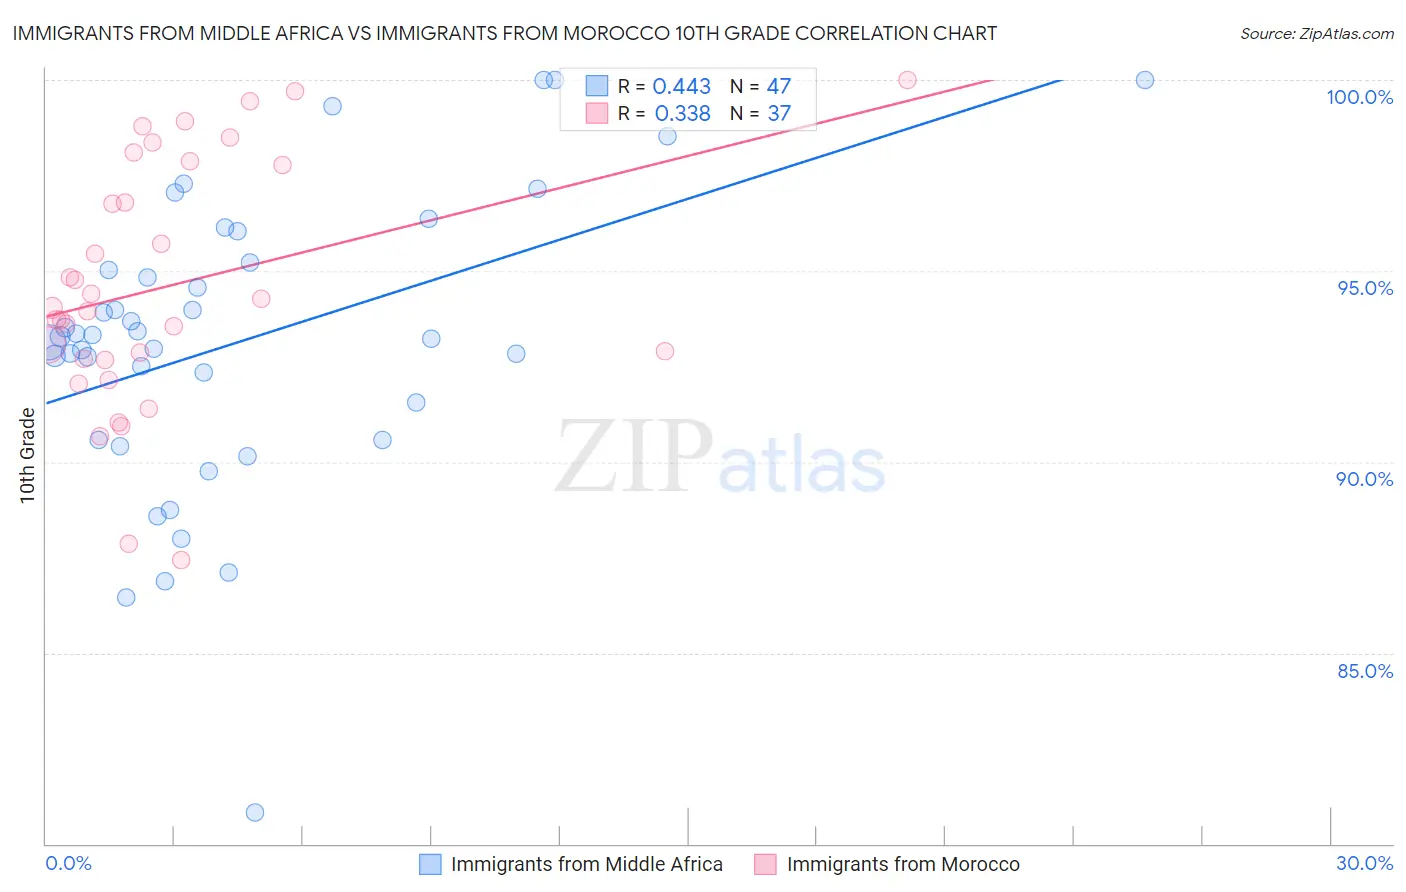
Immigrants from Middle Africa vs Immigrants from Morocco 10th Grade Correlation Chart
The statistical analysis conducted on geographies consisting of 202,726,551 people shows a moderate positive correlation between the proportion of Immigrants from Middle Africa and percentage of population with at least 10th grade education in the United States with a correlation coefficient (R) of 0.443 and weighted average of 92.9%. Similarly, the statistical analysis conducted on geographies consisting of 178,912,438 people shows a mild positive correlation between the proportion of Immigrants from Morocco and percentage of population with at least 10th grade education in the United States with a correlation coefficient (R) of 0.338 and weighted average of 93.5%, a difference of 0.69%.
10th Grade Correlation Summary
| Measurement | Immigrants from Middle Africa | Immigrants from Morocco |
| Minimum | 80.8% | 87.4% |
| Maximum | 100.0% | 100.0% |
| Range | 19.2% | 12.6% |
| Mean | 93.1% | 94.6% |
| Median | 93.3% | 94.0% |
| Interquartile 25% (IQ1) | 90.6% | 92.7% |
| Interquartile 75% (IQ3) | 95.2% | 97.8% |
| Interquartile Range (IQR) | 4.6% | 5.1% |
| Standard Deviation (Sample) | 3.9% | 3.2% |
| Standard Deviation (Population) | 3.8% | 3.2% |
Similar Demographics by 10th Grade
Demographics Similar to Immigrants from Middle Africa by 10th Grade
In terms of 10th grade, the demographic groups most similar to Immigrants from Middle Africa are Uruguayan (92.9%, a difference of 0.020%), Immigrants from Afghanistan (92.8%, a difference of 0.040%), Spanish American (92.9%, a difference of 0.050%), Colombian (92.8%, a difference of 0.050%), and Immigrants from Senegal (92.8%, a difference of 0.050%).
| Demographics | Rating | Rank | 10th Grade |
| Costa Ricans | 4.2 /100 | #239 | Tragic 93.1% |
| Immigrants | Hong Kong | 4.2 /100 | #240 | Tragic 93.1% |
| Immigrants | Somalia | 2.7 /100 | #241 | Tragic 93.0% |
| Immigrants | Cameroon | 2.6 /100 | #242 | Tragic 93.0% |
| Senegalese | 2.4 /100 | #243 | Tragic 93.0% |
| Spanish Americans | 2.1 /100 | #244 | Tragic 92.9% |
| Uruguayans | 1.8 /100 | #245 | Tragic 92.9% |
| Immigrants | Middle Africa | 1.7 /100 | #246 | Tragic 92.9% |
| Immigrants | Afghanistan | 1.4 /100 | #247 | Tragic 92.8% |
| Colombians | 1.4 /100 | #248 | Tragic 92.8% |
| Immigrants | Senegal | 1.4 /100 | #249 | Tragic 92.8% |
| Jamaicans | 1.2 /100 | #250 | Tragic 92.8% |
| Immigrants | Thailand | 1.0 /100 | #251 | Tragic 92.8% |
| South Americans | 0.9 /100 | #252 | Tragic 92.8% |
| Ghanaians | 0.9 /100 | #253 | Tragic 92.8% |
Demographics Similar to Immigrants from Morocco by 10th Grade
In terms of 10th grade, the demographic groups most similar to Immigrants from Morocco are Cheyenne (93.5%, a difference of 0.0%), Immigrants from Malaysia (93.5%, a difference of 0.010%), Panamanian (93.5%, a difference of 0.010%), Moroccan (93.5%, a difference of 0.020%), and Pueblo (93.5%, a difference of 0.040%).
| Demographics | Rating | Rank | 10th Grade |
| Liberians | 34.7 /100 | #187 | Fair 93.6% |
| Marshallese | 33.2 /100 | #188 | Fair 93.6% |
| Immigrants | Pakistan | 32.5 /100 | #189 | Fair 93.6% |
| Laotians | 32.1 /100 | #190 | Fair 93.6% |
| Yup'ik | 31.1 /100 | #191 | Fair 93.6% |
| Immigrants | Malaysia | 28.0 /100 | #192 | Fair 93.5% |
| Panamanians | 28.0 /100 | #193 | Fair 93.5% |
| Immigrants | Morocco | 26.9 /100 | #194 | Fair 93.5% |
| Cheyenne | 26.8 /100 | #195 | Fair 93.5% |
| Moroccans | 25.3 /100 | #196 | Fair 93.5% |
| Pueblo | 23.9 /100 | #197 | Fair 93.5% |
| Immigrants | Micronesia | 23.2 /100 | #198 | Fair 93.5% |
| Asians | 23.0 /100 | #199 | Fair 93.5% |
| Hopi | 22.2 /100 | #200 | Fair 93.5% |
| Hawaiians | 21.8 /100 | #201 | Fair 93.5% |